
Fundamentals of Fluid Flow in Porous Media
Chapter 5
Miscible Displacement
Fluid Phase Behavior: Tertiary Diagram
Ternary or triangular phase diagrams can be used to plot the phase behavior of systems consisting of three components by outlining the composition regions on the plot where different phases exist. The advantage of using a ternary plot for depicting compositions is that three variables can be conveniently plotted in a two-dimensional graph and mixture of different components can be easily represented. A ternary diagram for hypothetical components A, B and C is shown in Figure 5‑7.The phase behavior on ternary diagram is plotted at fixed pressure and temperature and If these three components were miscible at that special temperature and pressure then no multiphase region would appear on the diagram. Every point on a ternary plot represents a different combination of the three components. Compositions could be represented in ternary diagram as weight, mole or volume percentage. The volume percentage is used only when there is not significant volume change during the mixing. The vertexes represent the pure components, and the sides of equilateral triangle are scaled to represent the binary compositions of the three possible pairs.
There are three common methods used to determine the ratios of the three species in the composition. The first method is an estimation based upon the phase diagram grid. The concentration of each species is 100% (pure phase) in its corner of the triangle and 0% at the line opposite it. The percentage of a specific species decreases linearly with increasing distance from this corner, as seen in Figure 5‑7. By drawing parallel lines at regular intervals between the zero line and the corner (Figure 5‑7.a), fine divisions can be established for easy estimation of the content of a species. For a given point, the fraction of each of the three materials in the composition can be determined by the first. For phase diagrams that do not possess gridlines, the easiest way to determine the composition is to set the altitude of the triangle to 100% (that is equal to the sum of all altitudes from the mixture point to three sides) and determine the shortest distances from the point of interest to each of the three sides. The distances (the ratios of the distances to the total height of 100%) give the content of each of the species, as shown in Figure 5‑7.b. The third method is based upon a larger number of measurements, but does not require the drawing of perpendicular lines. Straight lines are drawn from each corner, through the point of interest, to the corresponding side of the triangle. The lengths of these lines, as well as the lengths of the segments between the point and the corresponding sides, are measured individually. Ratios can then be determined by dividing these segments by the entire corresponding line, by the so-called inverse-lever-arm rule, as shown in the Figure 5‑7.c.
In Figure 5‑7.c, point M is a mixture of ( Mb / Bb ) of component ‘B’ and (1 – Mb / Bb ) of binary mixture ‘b’ of ‘A’ and ‘C’. These 3 rules could be applied to the combination of any two mixtures represented on the ternary. Figure 5‑8 shows two different mixtures represented by M1 and M2. Any mixture of M1 and M2 would be along line M1M2 . The point representing the composition of the final mixture would again be determined by applying the inverse-lever-arm rule along the line.
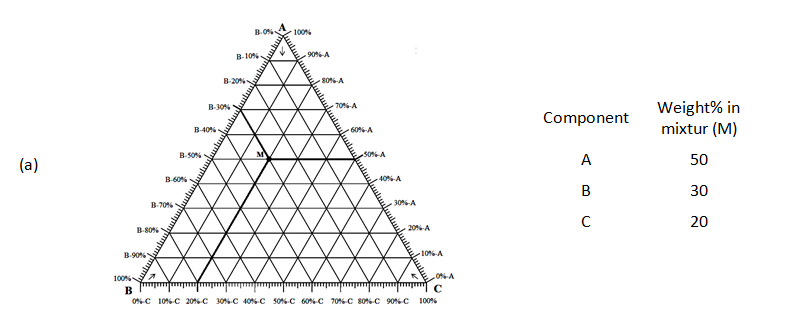

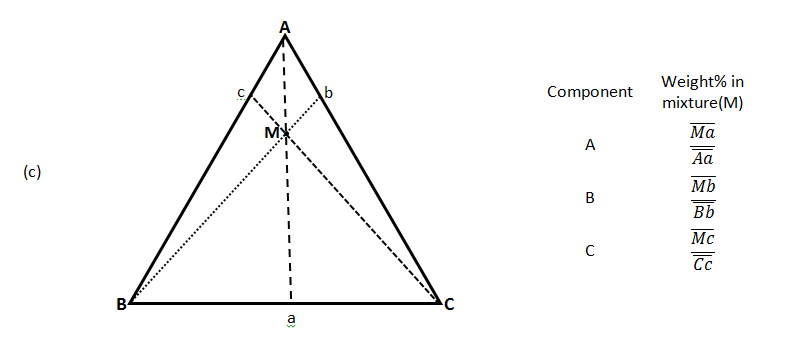
Figure 5-7: Ternary Phase Diagram for a System Consisting of Components A, B, and C Which are Miscible in All Proportions
Phase relationship may also be represented on a triangular phase diagram Figure 5‑11. The diagram shows the phase condition at equilibrium at constant pressure and temperature. The plot is typical for hydrocarbon systems in which vapor-liquid equilibrium exists over regions of the concentration domain.
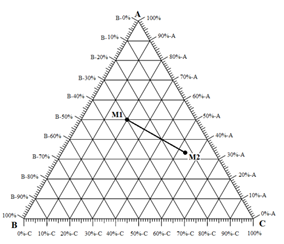
Figure 5-8: All Mixture of M1 and M2 Would Be Along Line M1M2
Example 5-2[fusion_builder_container hundred_percent=”yes” overflow=”visible”][fusion_builder_row][fusion_builder_column type=”1_1″ background_position=”left top” background_color=”” border_size=”” border_color=”” border_style=”solid” spacing=”yes” background_image=”” background_repeat=”no-repeat” padding=”” margin_top=”0px” margin_bottom=”0px” class=”” id=”” animation_type=”” animation_speed=”0.3″ animation_direction=”left” hide_on_mobile=”no” center_content=”no” min_height=”none”][50]
Figure 5‑9.a shows the phase behavior of mixtures of chemicals A, B and C. the diagram is on the pound mass basis and for a fixed T and P. three different mixtures of components A, B and C are contained in three vessels as shown in Figure 5‑9.b. The contents of three vessels are mixed together in forth vessel, which is held at the P and T corresponding to the ternary diagram. Describe the resulting mixture as follows:
- Find the final mixture composition, and show the overall composition on the diagram,
- Indicate whether the final mixture is one phase or two phase at specified T and P,
- If the mixture is two phase, specify the composition and amount of each phase.
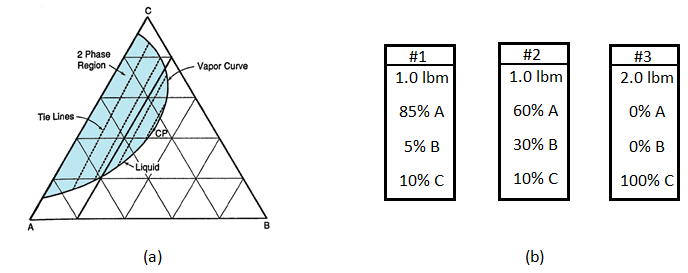
Figure 5-9: Example 5-2 a) Ternary Diagram, b) Chemicals To Be Mixed
Solution
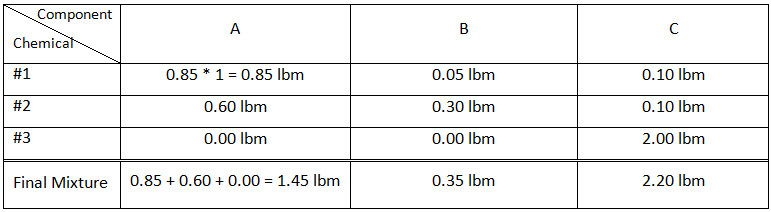
For the first step we should determine the mass of each components (A,B, and C) in each vessel using the composition and mass of the chemicals. Table 5‑1 contains the results for this step and sample calculation:
Table 5-1: Composition Calculation, Example 5-2
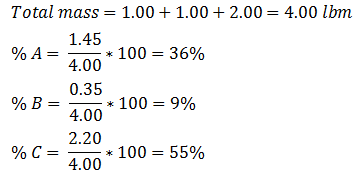
To find the composition of the final mixture, mass of each component should be divided by total mass:
Using methods explained before (Figure 5‑7), the final mixture could be shown in the diagram:
[fusion_builder_row_inner][fusion_builder_column_inner type=”1_2″ last=”no”]
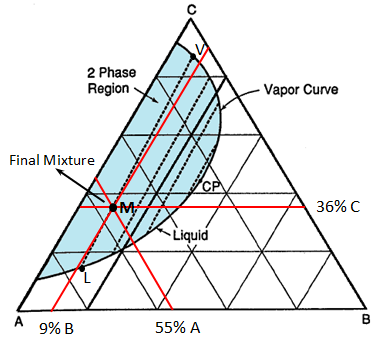
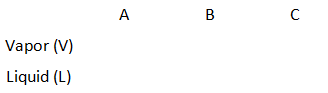
Figure 5-10: Liquid Vapour Phase Diagram for Example 5-2
[/fusion_builder_column_inner]
[fusion_builder_column_inner type=”1_2″ last=”yes”]
The composition of the final mixture located in the two phase region of the diagram.
To find the amount of each phase using the lever law:
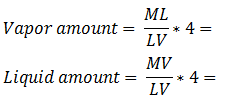
To find the composition of each phase using the methods explained in Figure 5‑7:
[/fusion_builder_column_inner][/fusion_builder_row_inner]
Reservoir fluids are complex mixture of hydrocarbons with components ranging from methane to C40+. In miscible displacement process a fluid miscible with the fluid reservoir during FCM or MCM process. This injected fluid alters thermodynamic properties of the reservoir fluid by changing the chemical composition of the reservoir fluid. Rigorous thermodynamic analysis needs identification of all chemical constitutes and their composition. But it is not practical. The experiences have shown that complex hydrocarbon systems can be represented with groups of hydrocarbons that preserve many of the important properties of the system. The combined groups of the hydrocarbons are called “pseudocomponents”. A decomposition of crude oil into CH4-N2, C2-C6, and C7+ components is a common example of “pseudocomponents”. A typical representation of miscible displacement process is a “pseudoternary” diagram with C1, C2-C6, and C7+as pseudocomponents as shown in Figure 5‑11.b. generally possible grouping that is used frequently includes the following mixed components:
- The first component represents a volatile pseudo component and most of the times contains C1, N2, CO2,
- The second pseudocomponent is a mixture of intermediate hydrocarbon components such as C2 through C6, sometimes CO2 is grouped in this group.
- The last group is essentially C7+ fraction of the reservoir hydrocarbon.
An important assumption in using pseudocomponents and a pseudoternary diagram is that the composition of the pseudocomponents does not change in the different phases.
Within the two phases region there are tie lines whose ends represents the composition of equilibrium phases (Figure 5‑11). Tie lines length shrinks toward the critical (plait) point where the properties of two phases are indistinguishable. The position of plait point changes with temperature at a fixed pressure. As Figure 5‑11.b shows, all composition represented by points (M1-M5) inside the two-phase envelop would separate into two phases (V1-V5 as vapor and L1-L5 as liquid), the relative amount of two phases can be calculated using inverse-lever-arm rule. The points outside the two phase envelop are representative of a single phase composition. The critical tie line is the fictitious tie line tangent to the bimodal curve at the critical point. The critical tie line is the limiting case of the actual tie line as the plait point is approached.
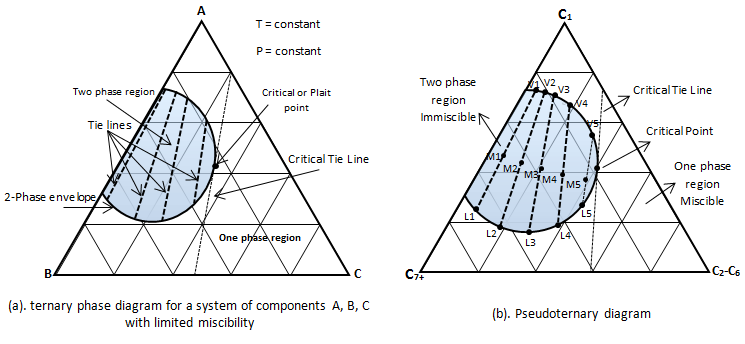
Figure 5-11: Ternary Phase Diagram
As the pressure increases, the two phase region shrinks, or in other words light-heavy miscibility increases (Figure 5‑12). No general statement is possible about the effect of temperature though the two phase region generally growth with increasing temperature.
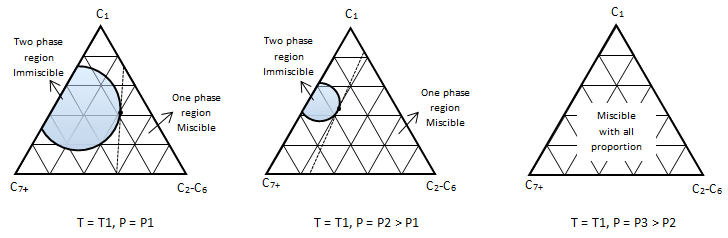
Figure 5-12: Pressure Effect on the Miscibility, P1 < P2 < P3
[fusion_builder_row_inner][fusion_builder_column_inner type=”1_3″ last=”no”]
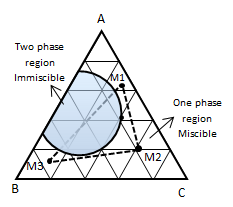
Figure 5-13: Determination of Miscible Condition from Ternary Diagram
[/fusion_builder_column_inner]
[fusion_builder_column_inner type=”2_3″ last=”yes”]
As mentioned in Error! Reference source not found., in ternary diagram the mixture results of any combination of two components will lie on a straight line connecting two components to each other. According to this, Figure 5‑13 shows that any combination of components A and C, and any combination of B and C, form a single phase, in other word in this specific pressure and temperature A and C, B and C are miscible. A and B are not miscible because the straight line between them pass through the two phase region, so mixing them with especial compositions will end with a two phase mixture. And with the same manner M1 and M2 are miscible the same as M2 and M3. But M3 and M1 are not miscible, because straight line between them passes through the two phase region (Figure 5‑13).
[/fusion_builder_column_inner][/fusion_builder_row_inner]
[fusion_separator top=”25″/]
[fusion_builder_row_inner][fusion_builder_column_inner type=”1_2″ last=”no”]
<< PRESSURE-COMPOSITION DIAGRAM
[/fusion_builder_column_inner]
[fusion_builder_column_inner type=”1_2″ last=”yes”]
[/fusion_builder_column_inner][/fusion_builder_row_inner]
[fusion_separator top=”35″/]
References
Questions?
If you have any questions at all, please feel free to ask PERM! We are here to help the community.[/fusion_builder_column][/fusion_builder_row][/fusion_builder_container]