
Fundamentals of Fluid Flow in Porous Media
Chapter 2
Permeability:
Measurement of Permeability
The permeability of a porous medium can be determined from the samples extracted from the formation or by in place testing such as well logging and well testing. Measurement of permeability in the case of isotropic media is usually performed on linear, mostly cylindrical shaped, “core” samples. Cores are cylinders with approximately 3.81cm (1.5 inch) diameter and 5 cm (2 inch) length. Sometimes the permeability tests run on a whole core samples about 30-50 cm long. The experiment can be arranged so as to have horizontal or vertical flow through the sample. Permeability is reduced by overburden pressure, and this factor should be considered in estimating permeability of the reservoir rock in deep wells because permeability is an anisotropic property of the porous rock, that is, it is directional. Routine core analysis is generally concerned with plug samples drilled parallel to bedding planes and, hence, parallel to the direction of flow in the reservoir. These yield horizontal permeabilities (Kh). The measured permeabilities on plugs that are drilled perpendicular to the bedding planes are referred to as vertical permeability (Kv). Both liquids and gases have been used to measure permeability. However liquids sometimes change the pore structure and therefore the permeability. For example injection of water to a sample with some amount of clay leads to decreasing permeability due to swelling of the clays. There are several factors that could lead to some of error in determining reservoir permeability. Some of these factors are:
- Core sample may not be representative of the reservoir rock because of reservoir heterogeneity.
- Core recovery may be incomplete.
- Permeability of the core may be altered when it is cut, or when it is cleaned and dried in preparation for analysis. This problem is likely to occur when the rock contains reactive clays.
As core samples usually contain water and oil, it is necessary to prepare the core samples for the test. Cores are dried in an oven or extracted by a Soxhlet extractor and then they are subsequently dried. The residual fluids are thus removed and the core samples become 100% saturated with air. In principle measurement at a steady single flow rate permits the “routine” calculation of the permeability from Darsy’s law. The core is inserted in a core holder. A pressure applied on the surface of the core as confining pressure. An appropriate pressure gradient is adjusted across the core sample and the rate of flow of air through the plug is observed. The permeability could be found from either equation (2‑32) or (2‑33). However there is considerable experimental error in this experiment so the requirement that permeability be determined for conditions of viscous flow is best satisfied by obtaining data at several flow rates and plotting the flow rate versus pressure drop, as shown in Figure 2‑25. A straight line is fitted to the data points. According to the Darcy’s law, the slope of this line is K / μ, and this line must pass through the origin. But at ultralow flow rates, the flow rate is not proportional to pressure drop. Darcy’s law should not be extrapolated to the origin. Deviation from the straight line at high flow rates is an indication of turbulent flow (Figure 2‑25). This deviation shows that the pressure drop in turbulent flow is higher than viscous flow. By increasing the pressure drop we can reach to a maximum flow rate capacity of the medium, after that flow rate will not increase by increasing the pressure drop.
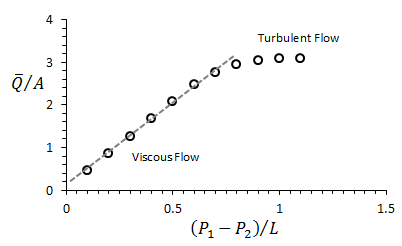
Figure 2-25: Plot of Experimental Results for Calculation of Permeability
The same experiment can be done with water or other liquids. In this case the core sample should be fully saturated with the testing liquid. When liquid is used as the testing fluid, care must be taken that it does not react with the solids in the core sample. The permeability of a core sample measured by flowing air is always greater than the permeability obtained when a liquid is the flowing fluid. Klinkenberg (1941) postulated, on the basis of his laboratory experiments, that liquids had a zero velocity at the sand grain surface, while gases exhibited some finite velocity at the sand grain surface. This resulted in a higher flow rate for the gas at a given pressure differential.
Correction can be applied for the change in permeability because the reduction in confining pressure on the sample.
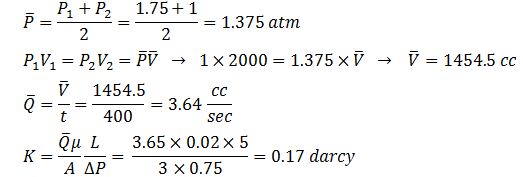
Example 2-6
The following data obtained during a routine permeability test at 70oF. Find the permeability.
- Flow rate = 2000 cc of air at 1 atm in 400 sec
- Downstream pressure = 1 atm
- Viscosity of air at test temperature = 0.02 cP
- Core cross sectional area = 3 cm2
- Core length = 5 cm
- Upstream Pressure = 1.75 atm
Solution
Measurements of permeability on large core samples generally yield better indication of permeability of limestone than do with small core sample. Rocks which contain fractures in situ separate along natural plane of weakness when cored. Therefore the conductivity of such fractures will not be included in the laboratory data.
Effect of reactive liquid on permeability
While water used as testing liquid in permeability determination, in samples with clay material water act as a reactive liquid in connection with permeability determination. Reactive liquids alter the internal geometry of the porous medium which causes permeability change. The effect of clay swelling in presence of water when water used as testing fluid in permeability test is the most known effect of a reactive testing fluid. The degree of swelling is a function of water salinity. While the fresh water may cause swelling of the cementation material in the core it is a reversible process. Highly saline water can pass through the core and return the permeability to its original value.
The Klinkenberg Effect
Klinkenberg (1941) reported a variation in the permeability test results with the pressure when gas is used as testing fluid. Klinkenberg found that for a given porous medium as the mean pressure increased the calculated permeability decreased. Mean pressure is defined as follow:

This variation caused by “gas slippage” phenomenon. The phenomenon of gas slippage occurs when the diameter of the capillary opening approaches the mean free path of the gas. As mentioned before in flowing of the gas through the porous media the velocity at the solid wall cannot, in general, be considered zero, but a so called “slip” or “drift” velocity at the wall must be taken into account. This effect becomes significant when the mean free path of the gas molecules is of comparable magnitude as the pore size. When the mean free path is such smaller than the pore size, the slip velocity becomes negligibly small. As in liquids the mean free path of molecules is of the order of the molecular diameter, so the no-slip condition always applied in liquid flow.
The mean free path of a gas is a function of molecular size and the kinetic energy of the gas. Therefore the “Klinkenberg Effect” is a function of the gas that is used as testing fluid and the conditions of the test like as pressure and temperature. Figure 2‑26 is a plot of the permeability of the porous medium as determined at various mean pressures using hydrogen, nitrogen and carbon monoxide as the testing fluids.
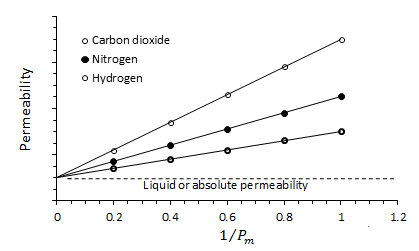
Figure 2-26: Permeability of Core Sample to Three Different Gases and Different Mean Pressure
Note that for each gas a straight line is observed for the observed permeability as a function of 1 / Pm. The data obtained with lowest molecular weight gas yields the straight line with greater slop, indicative of a greater slippage effect. All the line when extrapolated to infinite mean pressure, ( 1 / Pm = 0 ), intercept the permeability axes at a common point. This point is the equivalent liquid permeability, KL.
It is established that the permeability of a porous medium to a single phase liquid is equal to the equivalent liquid permeability.
The magnitude of the Klinkenberg effect varies with the core permeability as well as type of the gas used in the experiment as shown in Figure 2‑27.
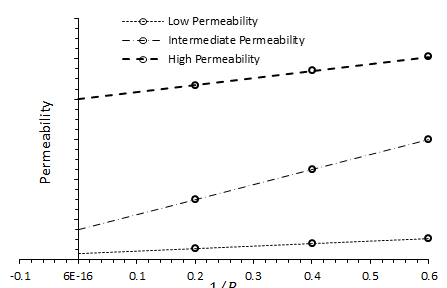
Figure 2-27: Effect of Permeability on the Magnitude of the Klinkenberg Effect
The resulting straight-line relationship can be expressed as:


Where:
- b = Klinkenberg factor
- Kg = measured gas permeability
- Pm = mean pressure
- KL = equivalent liquid permeability, i.e., absolute permeability, k
- m = slope of the line
- b = constant for a given gas in a given medium
Klinkenberg suggested that the “Klinkenberg factor” is a function of:
- Type of the gas used in measuring the permeability
- Pore throat size distribution
Since permeability is, in effect a measure of size opening in porous medium, it is found that b is a function of permeability. Jones (1972) studied the gas slip phenomena for a group of cores for which porosity, liquid permeability KL (absolute permeability), and air permeability were determined. He correlated the parameter b with the liquid permeability by the following expression:

The usual measurement of permeability is made with air at mean pressure just above atmospheric pressure. To obtain accurate measurement it is required to do approximately 12 flow tests. Permeability should be determined for 4 flow rates, each at three different mean pressures. This procedure permits the obtaining three value of permeability at three mean pressure values, from which permeability to liquid can be graphically determined. In the absence of such data, Equations (2‑36) and (2‑34) can be combined and arranged to give:

Equation (2‑44) can be used to calculate the absolute permeability when only one gas permeability measurement (kg) of a core sample is made at pm. This nonlinear equation can be solved iteratively by using the Newton- Raphson iterative methods. The proposed solution method can be conveniently written as:

Where:
- Ki = initial guess of the absolute permeability, md
- Ki+1 = new permeability value to be used for the next iteration
- i = iteration level
- f ( Ki ) = Equation 2-44 as evaluated by using the assumed value of Ki.
- f ́ ( Ki ) = first-derivative of Equation (2‑44) as evaluated at Ki
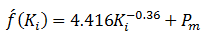
The first derivative of Equation (2‑44) with respect to Ki is:
Example (2-7)
The permeability of a core plug is measured by air. Only one measurement is made at a mean pressure of 2.152 psi. The air permeability is 46.6 md. Estimate the absolute permeability of the core sample. Compare the result with the actual absolute permeability of 23.66 md.
Solution
Substitute the given values of pm and kg into Equations (2‑44) and (2‑45)

Assume ki = 30 and apply the Newton-Raphson method to find the required solution as shown below.
| i | Ki | f ( Ki ) | f ́ ( Ki ) | Ki+1 |
| 1 | 30.000 | 25.12 | 3.45 | 22.719 |
| 2 | 22.719 | -0.466 | 3.29 | 22.861 |
| 3 | 22.861 | 0.414 | 3.29 | 22.848 |
After three iterations, the Newton-Raphson method converges to an absolute value for the permeability of 22.848 md.
Effect of overburden pressure
All the confining forces release and rock matrix expands when the core is removed from the formation. Fluid flow path in the rock changes by expansion of the rock’s matrix. Compaction of the core due to the overburden pressure may cause as much as 60% reduction in the permeability of various formations. So there is a need to an empirical correlation to correct the surface permeability for overburden pressure. It is noted that some formations are more compressible than others, so we need more data to develop this correlation.
Forscheimer Equation
ADD TEXT TO SECTION (Section Not Complete)
[fusion_builder_container hundred_percent=”yes” overflow=”visible” margin_top=”25″ margin_bottom=”” background_color=”rgba(255,255,255,0)”][fusion_builder_row][fusion_builder_column type=”1_1″ background_position=”left top” background_color=”” border_size=”” border_color=”” border_style=”solid” spacing=”yes” background_image=”” background_repeat=”no-repeat” padding=”” margin_top=”0px” margin_bottom=”0px” class=”” id=”” animation_type=”” animation_speed=”0.3″ animation_direction=”left” hide_on_mobile=”no” center_content=”no” min_height=”none”][fusion_separator /]
[/fusion_builder_column][/fusion_builder_row][/fusion_builder_container][fusion_builder_container hundred_percent=”yes” overflow=”visible”][fusion_builder_row][fusion_builder_column type=”1_2″ last=”no”]
<< FRACTURE SYSTEM PERMEABILITY
[/fusion_builder_column]
[fusion_builder_column type=”1_2″ last=”yes”]
SATURATION >>
[/fusion_builder_column]
[fusion_builder_column type=”1_1″ background_position=”left top” background_color=”” border_size=”” border_color=”” border_style=”solid” spacing=”yes” background_image=”” background_repeat=”no-repeat” padding=”” margin_top=”0px” margin_bottom=”0px” class=”” id=”” animation_type=”” animation_speed=”0.3″ animation_direction=”left” hide_on_mobile=”no” center_content=”no” min_height=”none”][fusion_separator top=”35″/]
References
[/fusion_builder_column][fusion_builder_column type=”1_1″ background_position=”left top” background_color=”” border_size=”” border_color=”” border_style=”solid” spacing=”yes” background_image=”” background_repeat=”no-repeat” padding=”” margin_top=”0px” margin_bottom=”0px” class=”” id=”” animation_type=”” animation_speed=”0.3″ animation_direction=”left” hide_on_mobile=”no” center_content=”no” min_height=”none”][1]
Questions?
If you have any questions at all, please feel free to ask PERM! We are here to help the community.[/fusion_builder_column][/fusion_builder_row][/fusion_builder_container]