
Fundamentals of Fluid Flow in Porous Media
Chapter 2
Multi-phase Saturated Rock Properties:
Averaging Capillary Pressure Data: Leverett J-Function
Capillary pressure data are obtained on small core samples that represent an extremely small part of the reservoir and, therefore, it is necessary to combine all capillary data to classify a particular reservoir. The fact that the capillary pressure-saturation curves of nearly all naturally porous materials have many features in common has led to attempts to devise some general equation describing all such curves. Leverett (1941) approached the problem from the standpoint of dimensional analysis. At first, Leverett made an attempt to convert all capillary pressure data to a universal curve. But, a universal capillary pressure curve does not exist because the rock properties affecting capillary pressures in reservoir have extreme variation with lithology (rock type). Realizing that capillary pressure should depend on the porosity, interfacial tension, and mean pore radius, Leverett defined the dimensionless function of saturation, which he called the J-function, as
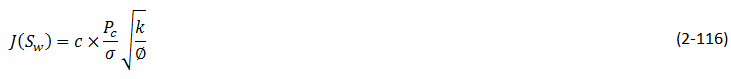
Where, c is constant.
In fact, The Leverett J-function is an attempt at extrapolating capillary pressure data for a given rock to rocks that are similar but with differing permeability, porosity and wetting properties. It assumes that the porous rock can be modelled as a bundle of non-connecting capillary tubes, where the factor √( k / ∅ ) is a characteristic length of the capillaries’ radii and Leverett interpreted √( k / ∅ ) as being proportional to the square of a mean pore radius.
For the same formation, however, this dimensionless capillary-pressure function serves quite well in many cases to remove discrepancies in the Pc versus Sw curves and reduce them to a common curve.
Some authors altered eq. (2‑116) by including cosθ:

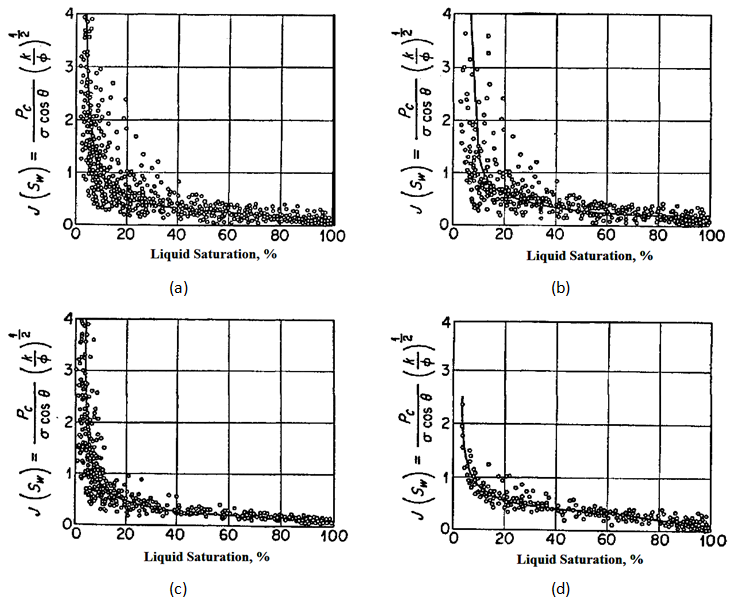
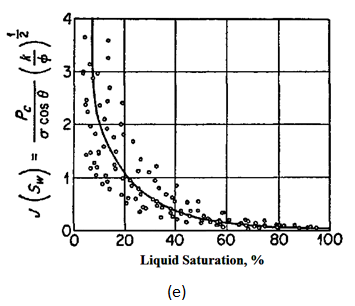
Field Scale example: Browns (1951) considered the j-function (eq. (2‑116)) as a correlating device for capillary pressure data of samples from Edwards formation in the Jourdanton field. () shows the correlation obtained for all samples available from the field. There is considerable dispersion of data points, although the trend of correlation is good. If core samples are divided to two different groups (limestone and dolomites) according to their texture, the correlation will be improved. () shows the correlations for the limestone and dolomite samples respectively. The dolomite samples show a good correlation while the limestone sample data shows a scattering of data in the range of lower water saturation. If the limestone samples are subdivided to micro-granular and coarse-grained samples, the correlation for each of them will be improved (). Scattering of data for the coarse-grained limestone samples are greater than other groups of samples. This is to be expected, as the coarse-grained limestone contains solution cavities, vugs and channels which are not capillary in size, hence deviation from trends established in capillary-pressure data.
[fusion_builder_container hundred_percent=”yes” overflow=”visible”][fusion_builder_row][fusion_builder_column type=”1_2″ last=”no”]
[/fusion_builder_column]
[fusion_builder_column type=”1_2″ last=”yes”]
[fusion_separator top=”25″/]
(a). J curve for all cores
(b). J curve for Limestone cores
(c). J curve for dolomite cores
(d). J curve for micro-granular limestone cores
(e). J curve for coarse-grained limestone cores
[/fusion_builder_column]
Figure 2-73: J-Function Correlation of Capillary Pressure Data in Edwards Jourdanton Field
Example 2‑7
A laboratory capillary pressure test was conducted on a core sample taken from the Nameless Field. The core has a porosity and permeability of 16% and 80 md, respectively. The capillary pressure-saturation data are given as follows:
| Sw | Pc (psi) |
| 1.0 | 0.50 |
| 0.8 | 0.60 |
| 0.6 | 0.75 |
| 0.4 | 1.05 |
| 0.2 | 1.75 |
The interfacial tension is measured at 50 dynes/cm. Further reservoir engineering analysis indicated that the reservoir is better described at a porosity value of 19% and an absolute permeability of 120 md. Generate the capillary pressure data for the reservoir.
Solution
Calculate the J-function using the measured capillary pressure data and eq. (2‑116).
| Sw | Pc (psi) | J( Sw ) |
| 1.0 | 0.50 | 0.048 |
| 0.8 | 0.60 | 0.058 |
| 0.6 | 0.75 | 0.073 |
| 0.4 | 1.05 | 0.102 |
| 0.2 | 1.75 | 0.169 |
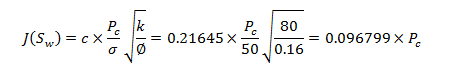
At the next step, Using the new porosity and permeability values, solve eq. (2‑116) for the capillary pressure Pc.
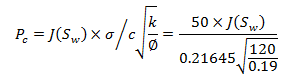
| Sw | J( Sw ) | Pc (psi) |
| 1.0 | 0.048 | 0.441 |
| 0.8 | 0.058 | 0.533 |
| 0.6 | 0.073 | 0.671 |
| 0.4 | 0.102 | 0.938 |
| 0.2 | 0.169 | 1.553 |
[fusion_builder_column type=”1_1″ background_position=”left top” background_color=”” border_size=”” border_color=”” border_style=”solid” spacing=”yes” background_image=”” background_repeat=”no-repeat” padding=”” margin_top=”0px” margin_bottom=”0px” class=”” id=”” animation_type=”” animation_speed=”0.3″ animation_direction=”left” hide_on_mobile=”no” center_content=”no” min_height=”none”][fusion_separator top=”25″/]
[/fusion_builder_column][fusion_builder_column type=”1_2″ last=”no”]
<< JAMIN EFFECT
[/fusion_builder_column]
[fusion_builder_column type=”1_2″ last=”yes”]
[/fusion_builder_column]
[fusion_builder_column type=”1_1″ background_position=”left top” background_color=”” border_size=”” border_color=”” border_style=”solid” spacing=”yes” background_image=”” background_repeat=”no-repeat” padding=”” margin_top=”0px” margin_bottom=”0px” class=”” id=”” animation_type=”” animation_speed=”0.3″ animation_direction=”left” hide_on_mobile=”no” center_content=”no” min_height=”none”][fusion_separator top=”35″/]
References
[/fusion_builder_column][fusion_builder_column type=”1_1″ background_position=”left top” background_color=”” border_size=”” border_color=”” border_style=”solid” spacing=”yes” background_image=”” background_repeat=”no-repeat” padding=”” margin_top=”0px” margin_bottom=”0px” class=”” id=”” animation_type=”” animation_speed=”0.3″ animation_direction=”left” hide_on_mobile=”no” center_content=”no” min_height=”none”][1]
Questions?
If you have any questions at all, please feel free to ask PERM! We are here to help the community.[/fusion_builder_column][/fusion_builder_row][/fusion_builder_container]