
Fundamentals of Fluid Flow in Porous Media
Chapter 2
Relative Permeability
Laboratory Measurements of Relative Permeability: Unsteady State Techniques
Experimentally and computationally the unsteady state technique is far more complicated. Following is a schematic diagram of an unsteady-state test apparatus.
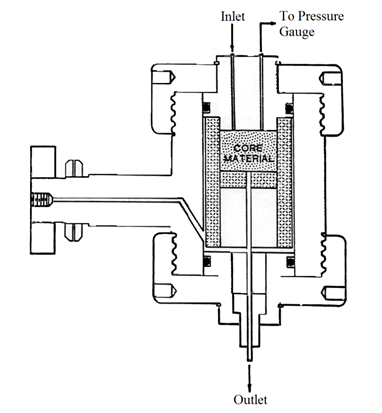
Figure 2-79: Unsteady State Apparatus
As can be seen, there is only one inlet since only one phase is injected into the core. The major difference in unsteady state techniques is that saturation equilibrium is not achieved during the test. As well, fluids are not injected simultaneously into the core. Instead, the test involves displacing in-situ fluids with a constant rate/pressure driving fluid. The outlet fluid composition and flow rate is measured and used in determining the relative permeability. Figure 2‑80-b shows an example of such a curve from an unsteady state waterflood experiment. At the beginning of the experiment, the core is saturated with 80% oil, and there is an irreducible water saturation of 20% due to the water wet nature of this particular example. Point A (Figure 2‑80-a) represents the permeability of oil under these conditions. Note that it is equal to unity, because this measurement has been taken as the base permeability. Point B represents the beginning water permeability. Note that it is equal to zero because irreducible water is, by definition, immobile. Water is then injected into the core at one end at a constant rate. The volumes of the emerging fluids (oil and water) are measured at the other end of the core, and the differential pressure across the core is also measured. During this process the permeability to oil reduces to zero along the curve ACD, and the permeability to water increases along the curve BCE. Note that there is no further production of oil from the sample after kro= 0 at point D, and so point D occurs at the irreducible oil saturation, Sor. Figure 2‑80-a is a simplified schematic diagram detailing the fluid saturation in the core during a typical unsteady-state test.
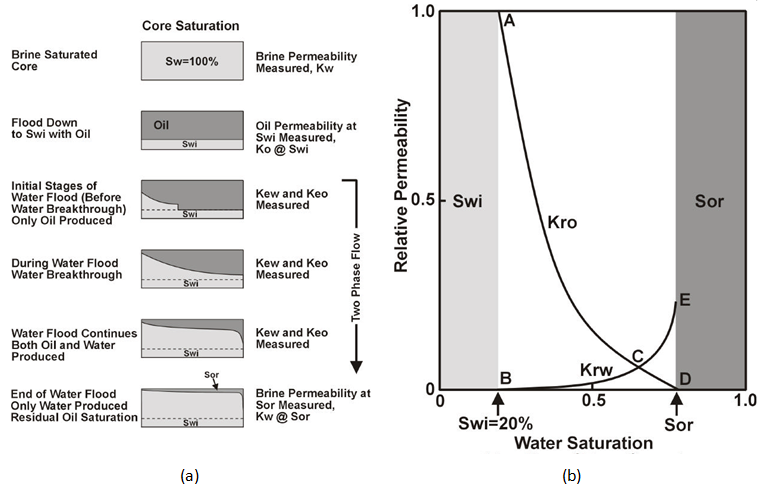
Figure 2-80: (a) Unsteady State Water Flood Proceudre, (b) Typical Relative Permeability Curve
Since steady state is not reached, Darcy’s Law is not applicable. The Buckley-Leverett equation for linear fluid displacement is the basis for all calculations. The Johnson-Bossler-Naumann (JBN) solution is used most often for calculating relative permeabilites from unsteady-state displacement tests.
It must be stressed, however, that these curves are not a unique function of saturation, but are also dependent upon fluid distribution. Thus the data obtained can be influenced by saturation history and flow rate. The choice of test method should be made with due regard for reservoir saturation history, rock and fluid properties. The wetting characteristics are particularly important. Test plugs should either, be of similar wetting characteristics to the reservoir state, or their wetting characteristics be known so that data can be assessed properly.
JBN Analysis
The experimental data generally recorded includes:
| Qi | : | Quantity of displacing phase injected |
| ΔP | : | Pressure differential |
| ΔPi | : | Pressure differential at initial conditions |
| Qo | : | Volume of oil produced |
| Qw | : | Volume of water produced |
These data are analysed by the technique described by Johnson, Bossler and Nauman, which is summarised below[fusion_builder_container hundred_percent=”yes” overflow=”visible”][fusion_builder_row][fusion_builder_column type=”1_1″ background_position=”left top” background_color=”” border_size=”” border_color=”” border_style=”solid” spacing=”yes” background_image=”” background_repeat=”no-repeat” padding=”” margin_top=”0px” margin_bottom=”0px” class=”” id=”” animation_type=”” animation_speed=”0.3″ animation_direction=”left” hide_on_mobile=”no” center_content=”no” min_height=”none”][1]. Three calculation stages are involved:
- The ratio kro / krw.
- The values of kro and hence krw.
- The value of Sw.
The method is aimed at giving the required values at the outlet face of the core which is essentially where volumetric flow observations are made.
(a). kro / krw :
The average water saturation ( Swav ) is plotted against Qi (Figure 2‑81-a).
Fractional flow of oil, at the outlet face of the core sample is:

Also we have:
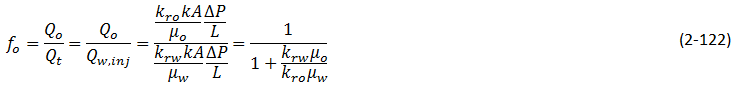
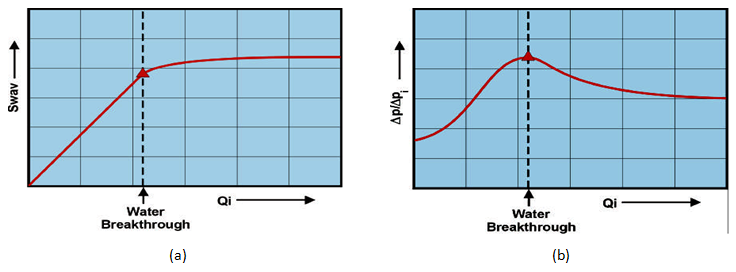
Figure 2-81: (a) Average Water Saturation vs. Water Injection, (b) Injectivity Ratio
(b). kro:
A plot of ( ΔP / ΔPi ) against Qi is used to obtain injectivity ratio (Figure 2‑81-b).

kro is obtained by plotting 1 / ( QiIR ) versus 1 / ( Qi ) :
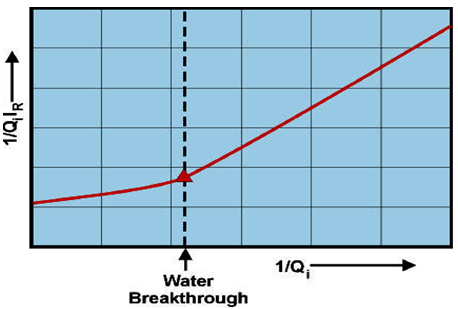
and using the relationship:

krw can be calculated from eq. (2‑121), or:

Unsteady state tests are popular because they require much less time and money than steady state tests to operate. However, it must be noted that the values obtained from these tests are generally less reliable. This is for a number of reasons. For one, the system is not at steady state when measurements are taken. Therefore, properties are still changing at that estimated saturation level. This leads to repeatability concerns. The relative permeability calculated during one un-steady state run at a certain saturation level could be quite different from a run performed earlier. For this reason lower confidence is placed on the actual value determined from displacement tests. Another concern is that the interpretation techniques introduce many simplifying assumptions. For example, the Welge method (utilized in the JBN solution) was developed with respect to a homogeneous reservoir, so it might not be entirely accurate if applied to a heterogeneous one. Also, the Buckley-Leverett equation was developed for incompressible/immiscible fluids and assumes completely linear displacement. For all these reasons, values obtained from unsteady state tests should be considered as qualitative, and not representative of the reservoir. As a note, viscous fingering is a definite concern with the majority of unsteady-state tests, but it has been found that the centrifuge method can be used to eliminate these problems.
[fusion_separator top=”25″/]
[fusion_builder_row_inner][fusion_builder_column_inner type=”1_2″ last=”no”]
[/fusion_builder_column_inner]
[fusion_builder_column_inner type=”1_2″ last=”yes”]
DETERMINING FLUID SATURATIONS >>
[/fusion_builder_column_inner][/fusion_builder_row_inner]
[fusion_separator top=”35″/]
References
[1] Honarpour, M., Mahmood, S.M (1988)
Questions?
If you have any questions at all, please feel free to ask PERM! We are here to help the community.[/fusion_builder_column][/fusion_builder_row][/fusion_builder_container]