
Fundamentals of Fluid Flow in Porous Media
Chapter 2
Pore Size Distribution
There is not a unique definition of “pore diameter” or “pore size”. Every method of pore size determination defines a pore size in terms of a pore model which is best suited to the quantity measured in the particular experiment. There is the same situation for the definition of void space. For simplicity it is usually restricted to the pore space enclosed between “solid” surfaces. Given that the pore space consists of an irregular network of pores, there are terms to distinguish between pore spaces that are relatively narrow and the interconnected relatively larger spaces. The narrow constrictions that interconnect relatively larger spaces are called pore throats or pore necks, with pore throats being the more common term. While the relatively larger pore spaces are called pore bodies, node pores or bulge pores, with pore bodies being the most commonly used term (Figure 2‑12).
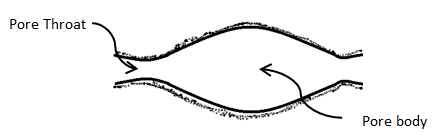
Figure 2-12: Schematic Shape of pore and Pore Throat
In the vast majority of porous media, the pore sizes are distributed over a wide spectrum of values, called “pore size distribution”. On the other word pore size distribution is a probability density function giving the distribution of pore volume by a characteristic pore size. If the pores were separated objects then each pore could be assigned a size according to some consistent definition, and the pore size distribution would become analogous to the particle size distribution obtained, for example, by sieve analysis. A sieve analysis (or gradation test) is a practice or procedure used to assess the particle size distribution (also called gradation) of a granular material. A sieve analysis is performed on a sample of aggregate in a laboratory. A typical sieve analysis involves a nested column of sieves with wire mesh cloth (screen) (Figure 2‑13). A representative weighed sample is poured into the top sieve which has the largest screen openings. Each lower sieve in the column has smaller openings than the one above. At the base is a round pan, called the receiver. The column is typically placed in a mechanical shaker. The shaker shakes the column, usually for some fixed amount of time. After the shaking is complete the material on each sieve is weighed. The weight of the sample of each sieve is then divided by the total weight to give a percentage retained on each sieve. The size of the average particles on each sieve then being analysis to get the cut-point or specific size range captured on screen.
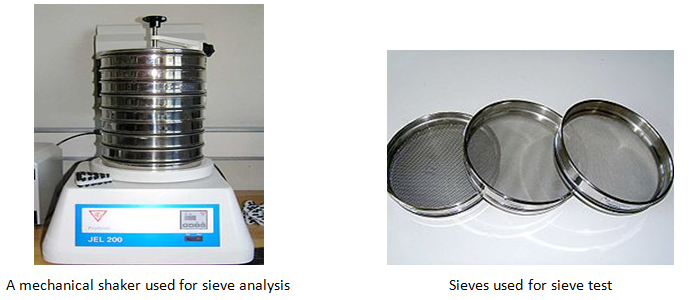
Figure 2-13: Sieve Analysis Tools
The pore in the interconnected pore space, however are not separated objects, and the volume assigned to a particular pore size depends on both the experimental method and the pore structure model used.
Methods of measurement
The most popular methods of determining pore size distribution are mercury intrusion porosimetery sorption isotherm and image analysis. The first of these is used mostly but not exclusively to determine the size of relatively larger pores whereas sorption isotherms are best suited in the case of smaller pores. The use of imaging to analyze section of a sample has some advantages over the other two methods, but the most complete information on pore size distribution may be obtained if all three methods are used jointly.
Mercury porosimetry:
Mercury porosimetry characterizes a material’s porosity by applying various levels of pressure to a sample immersed in mercury. The pressure required to intrude mercury into the sample’s pores is inversely proportional to the size of the pores, so at the same times it finds pore size distribution.
Theory and key assumption: a key assumption in mercury porosimetry is the pore shape. Essentially all instruments assume a cylindrical pore geometry using a modified Young-Laplace equation:

It relates the pressure difference across the curved mercury interface (r1 and r2 describe the curvature of that interface) to the corresponding pore size using the surface tension of mercury (σ) and the contact angle between solid and mercury. The real pore shape is however quite different and cylinder pore shape assumption may lead to major differences between reality and analysis. As indicated in equation (2‑5), we need to know surface tension and contact angle for the given sample and then measure the pressure and the intruded volume in order to obtain the pore volume-pore size relation. Mercury is completely non wetting phase for each sample and in general, the surface tension of mercury is not of any great concern with respect to errors in the determination of pore size distribution. A value 0.485 N/m at 25oC is commonly accepted by most researchers. The contact angle is a parameter which clearly affects the analysis results and numerous paper have demonstrated the wide range of contact angle between mercury and various different or even very similar solid surface. However in most practical situations and out of convenience users often apply a fixed value irrespective of the specific sample material, e.g. 130o or 140o.
Mercury porosimetry also has limitations. One of the most important limitations is the fact that mercury porosimetry does not actually measure the internal pore size, but it rather determines the largest connection (throat or pore channel) from the sample surface towards that pore. Thus, mercury porosimetry results will always show smaller pore sizes compare to the image analysis method results. For obvious reasons it can also not be used to analyze closed pores, since the mercury has no way of entering that pore. The smallest pore size, which can be filled with mercury, is limited by the maximum pressure, which can be achieved by the instrument, e.g. 3.5 nm diameter at 400 MPa assuming a contact angle of 140°.
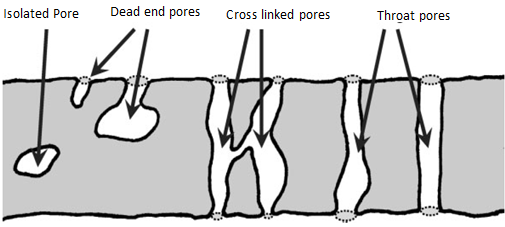
Figure 2-14: Schematic representation of pores
Sorption Method:
Sorption (Adsorption – Desorption) measurements involve the measurement of the surface area and the small size pores of a given medium. This method is based on the commencement of condensation with increasing capillary pressure (Note: condensation starts in the smallest pores and proceeds to increasingly larger pores). There are many models available for the adsorption of gases onto solids where the volume adsorbed is a function of pressure with constant temperature.
Basic equation and method: the fundamental equation to find the pore size distribution from capillary condensation isotherms is as follow:

Where VS is the volume of adsorbate at saturation vapor pressure (equal to the total pore volume), V the volume of adsorbate at intermediate vapor pressure P”, L(R)dR the total length of pores whose total length fall between R and R + dR, R pore radius, and (t) the multilayer thickness that is built up at pressure P”. This equation states the fact that the volume of adsorbed at pressure P” is equal to the volume of pores that has not yet been filled.
Micro-tomography:
A modern tool for the determination of pore properties is x-ray micro-tomography. With this technique as small sample (less than 1cm in diameter) is exposed to x-rays and a three dimensional reconstruction of the sample is created typically at a resolution of ~1 micron (Figure 2‑15). From the three dimensional object information about the pore space, connectivity, total porosity and mineral content can be obtained. The limitation of the technique is related to the resolution of the created images. There are very powerful micro-tomography systems associated with synchrotron facilities and bench top devices.
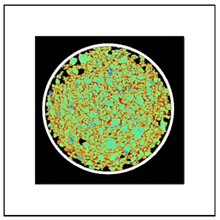
Figure 2-15: Tomographic image
Other image analysis methods:
ADD TEXT TO SECTION (Section Not Complete)
[fusion_builder_container hundred_percent=”yes” overflow=”visible” margin_top=”25″ margin_bottom=”” background_color=”rgba(255,255,255,0)”][fusion_builder_row][fusion_builder_column type=”1_1″ background_position=”left top” background_color=”” border_size=”” border_color=”” border_style=”solid” spacing=”yes” background_image=”” background_repeat=”no-repeat” padding=”” margin_top=”0px” margin_bottom=”0px” class=”” id=”” animation_type=”” animation_speed=”0.3″ animation_direction=”left” hide_on_mobile=”no” center_content=”no” min_height=”none”][fusion_separator /]
[/fusion_builder_column][/fusion_builder_row][/fusion_builder_container][fusion_builder_container hundred_percent=”yes” overflow=”visible”][fusion_builder_row][fusion_builder_column type=”1_2″ last=”no”]
[/fusion_builder_column]
[fusion_builder_column type=”1_2″ last=”yes”]
[/fusion_builder_column]
[fusion_builder_column type=”1_1″ background_position=”left top” background_color=”” border_size=”” border_color=”” border_style=”solid” spacing=”yes” background_image=”” background_repeat=”no-repeat” padding=”” margin_top=”0px” margin_bottom=”0px” class=”” id=”” animation_type=”” animation_speed=”0.3″ animation_direction=”left” hide_on_mobile=”no” center_content=”no” min_height=”none”][fusion_separator top=”35″/]
References
[/fusion_builder_column][fusion_builder_column type=”1_1″ background_position=”left top” background_color=”” border_size=”” border_color=”” border_style=”solid” spacing=”yes” background_image=”” background_repeat=”no-repeat” padding=”” margin_top=”0px” margin_bottom=”0px” class=”” id=”” animation_type=”” animation_speed=”0.3″ animation_direction=”left” hide_on_mobile=”no” center_content=”no” min_height=”none”][1]
Questions?
If you have any questions at all, please feel free to ask PERM! We are here to help the community.[/fusion_builder_column][/fusion_builder_row][/fusion_builder_container]