
Fundamentals of Fluid Flow in Porous Media
Chapter 5
Miscible Displacement
Fluid Phase Behavior: Pressure-Composition Diagram
Pressure-composition diagram is another way to present the phase behavior information. Usually the composition is expressed as a mole fraction of the more volatile component (Figure 5‑5).
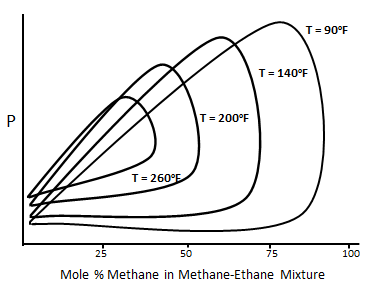
Figure 5-5: Typical P-X Diagram for the Methane-normal Butane System
For a binary system at temperature higher than the critical temperature of volatile component, two phases do not form over all compositions of the more volatile component. For the system that shown in Figure 5‑5 at 90°F two phases are not formed above the methane composition of about 90%. The composition of methane above which only one phase exists decease with increasing temperature. The p-x diagram also shows the cricondenbar pressure for each temperature. For each temperature cricondenbar is the maximum pressure that two phases can exist. Above this pressure all methane- ethane mixtures will be a single phase, in other words complete miscibility exist. Figure 5‑6 presents a p-x diagram for a three components system consisting of methane, n-butane and decane at a fixed temperature of 160°F[fusion_builder_container hundred_percent=”yes” overflow=”visible”][fusion_builder_row][fusion_builder_column type=”1_1″ background_position=”left top” background_color=”” border_size=”” border_color=”” border_style=”solid” spacing=”yes” background_image=”” background_repeat=”no-repeat” padding=”” margin_top=”0px” margin_bottom=”0px” class=”” id=”” animation_type=”” animation_speed=”0.3″ animation_direction=”left” hide_on_mobile=”no” center_content=”no” min_height=”none”][1]. The graph is pressure versus mol% of methane adding to the reservoir mixture containing methane, butane, and decane. A single phase exists above the phase-boundary line, while two phases exist below this line. Miscibility condition of added methane (C1) and reservoir fluid could be find from the graph. For example, if incremental amounts of C1 were added to the reservoir fluid at a constant pressure of 2000 psia and temperature of 160°F, the mixture of fluid would be single phase as long as the concentration of added C1 was less than about 25 mol%. Further C1 addition would cause a gas phase separates from the liquid phase. However miscibility would be reached if the concentration of added C1 exceeds about 97%. At low-gas concentration end, gas goes into solution in the liquid, while at the high-gas concentration end, the liquid is vaporized into the gas. If the pressure on the system were raised to a value equal or higher than cricondenbar pressure, then addition of C1 to the reservoir fluid would not cause two phases to form and the gas C1 and reservoir fluid would be single phase over all possible concentration of added C1.
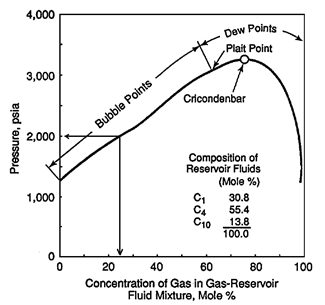
Figure 5-6: Pressure-Composition Diagram for Mixture of C1 with a Liquid Mixture of C1-nC4-C10
Adding some heavier hydrocarbons, such as C4, to the injected gas causes shifting down the cricondenbar. So miscibility condition reaches at lower pressure.
[fusion_separator top=”25″/]
[fusion_builder_row_inner][fusion_builder_column_inner type=”1_2″ last=”no”]
<< PRESSURE-TEMPERATURE DIAGRAM (P-T)
[/fusion_builder_column_inner]
[fusion_builder_column_inner type=”1_2″ last=”yes”]
[/fusion_builder_column_inner][/fusion_builder_row_inner]
[fusion_separator top=”35″/]
References
[1] “Enhanced Oil Recovery”, D. W. Green and G. P. Willhite, 1998
Questions?
If you have any questions at all, please feel free to ask PERM! We are here to help the community.[/fusion_builder_column][/fusion_builder_row][/fusion_builder_container]