
Fundamentals of Fluid Flow in Porous Media
Chapter 2
Multi-phase Saturated Rock Properties:
Saturation History: Capillary Pressure vs. Wetting Phase Saturation in Rock
Figure 2‑48 showed the capillary pressure vs. non wetting phase saturation in a capillary tube. As mentioned by increasing the non-wetting phase saturation by σ higher than the (2σ)/r the capillary tube will be totally filled with non-wetting phase. Now assume that there is a bundle of capillary tubes with different radius sizes (r1>r2>…>rn, r: capillary tube radius) that is fully saturated with wetting phase and we want to displace the saturating fluid with non-wetting phase by increasing the pressure (Figure 2‑51.a). Non-wetting phase will not enter to the medium till pressure reaches to (2σ)/r1 + ε, that non-wetting phase completely swipes the largest capillary tube completely. Decrease in the wetting saturation is equal to the volume fraction of the largest tube in the bundled. Figure 2‑51.b that a finite capillary pressure must be applied (i.e., the breakthrough capillary pressure, Pc° = (2σ)/r1 + ε) during primary drainage before any appreciable amount of wetting phase drains out of the sample. Then by increasing the pressure there will not any change in the saturation till the pressure reaches to (2σ)/r2 + ε , that the non-wetting phase enters to the second largest capillary tube and the wetting phase saturation decreases by a value equal to the second largest capillary tube volume fraction in the bundle. By continuing this process we will end with the following graph (Figure 2‑51.b).when the pressure reach to the (2σ)/rn + ε the bundle will be fully saturated with the non-wetting phase. As the Figure 2‑51.b shows by increasing the pressure saturation change amount decreases because of decreasing in the volume fraction of smaller capillary tubes in the bundle.
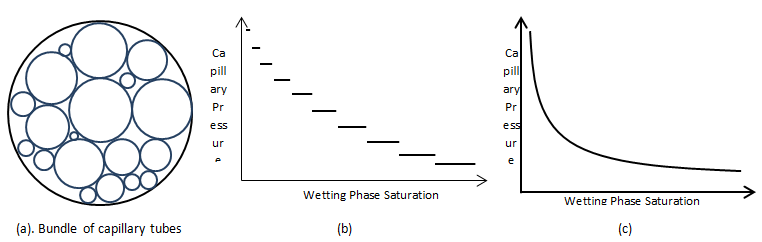
Figure 2-51: Capillary Pressure versus Wetting Phase Saturation
By increasing the number of capillary tubes with different size to have a continuous spectrum of capillary sizes, discontinuity in the capillary curve can be eliminated (Figure 2‑51.c).
According to this test it is obvious that shape of the capillary pressure curve is affected directly by pore size distribution and wettability of the porous medium.
Illustrated process is a named “Drainage” that the wetting phase is displaced by a non-wetting phase. The inverse process is “Imbibition Process” that wetting phase is the displacing fluid. If the non-wetting phase pressure at the final step of the drainage process (in the bundle of tubes test) decrease to (2σ)/rn – ε , wetting phase will swept the smallest capillary tube (rn) completely. Other capillary tubes could be swept by wetting phase by continuing decrease in the non-wetting phase pressure. It could be concluded that the imbibition process starts from flooding the smallest capillary tubes (or pores in the rocks) in contrast to the drainage that starts from the largest ones.
It is thus seen that the capillary pressure saturation relationship is depend upon:
- Size and distribution of the pores,
- The fluid and solid that are involved,
- The history of the saturation process.
Thus in order to use the capillary pressure data properly, these factors should be considered before the data are actually applied to the reservoir calculations.
Figure 2‑52 is an example of typical oil-water capillary pressure curves. In this case, capillary pressure is plotted versus water saturation for four rock samples with permeabilities increasing from k1 to k4 . It can be seen that, for decreases in permeability, there are corresponding increases in capillary pressure at a constant value of water saturation. This is a reflection of the influence of pore size since the smaller diameter pores will invariably have the lower permeabilities. Also, as would be expected the capillary pressure for any sample increases with decreasing water saturation, another indication of the effect of the radius of curvature of the water-oil interface.
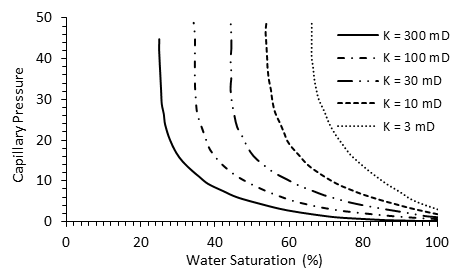
Figure 2-52: Variation of Capillary Pressure with Permeability
[fusion_builder_container hundred_percent=”yes” overflow=”visible” margin_top=”25″ margin_bottom=”” background_color=”rgba(255,255,255,0)”][fusion_builder_row][fusion_builder_column type=”1_1″ background_position=”left top” background_color=”” border_size=”” border_color=”” border_style=”solid” spacing=”yes” background_image=”” background_repeat=”no-repeat” padding=”” margin_top=”0px” margin_bottom=”0px” class=”” id=”” animation_type=”” animation_speed=”0.3″ animation_direction=”left” hide_on_mobile=”no” center_content=”no” min_height=”none”][fusion_separator /]
[/fusion_builder_column][/fusion_builder_row][/fusion_builder_container][fusion_builder_container hundred_percent=”yes” overflow=”visible”][fusion_builder_row][fusion_builder_column type=”1_2″ last=”no”]
[/fusion_builder_column]
[fusion_builder_column type=”1_2″ last=”yes”]
EFFECT OF PORE GEOMETRY ON CAPILLARY PRESSURE >>
[/fusion_builder_column]
[fusion_builder_column type=”1_1″ background_position=”left top” background_color=”” border_size=”” border_color=”” border_style=”solid” spacing=”yes” background_image=”” background_repeat=”no-repeat” padding=”” margin_top=”0px” margin_bottom=”0px” class=”” id=”” animation_type=”” animation_speed=”0.3″ animation_direction=”left” hide_on_mobile=”no” center_content=”no” min_height=”none”][fusion_separator top=”35″/]
References
[/fusion_builder_column][fusion_builder_column type=”1_1″ background_position=”left top” background_color=”” border_size=”” border_color=”” border_style=”solid” spacing=”yes” background_image=”” background_repeat=”no-repeat” padding=”” margin_top=”0px” margin_bottom=”0px” class=”” id=”” animation_type=”” animation_speed=”0.3″ animation_direction=”left” hide_on_mobile=”no” center_content=”no” min_height=”none”][1]
Questions?
If you have any questions at all, please feel free to ask PERM! We are here to help the community.[/fusion_builder_column][/fusion_builder_row][/fusion_builder_container]