
Fundamentals of Fluid Flow in Porous Media
Chapter 3
Diffusion Coefficient: Measurement Techniques
NMR Method: Typical NMR Experiment
The above theory for an entire NMR experiment involves these procedures: the first step is to polarize the hydrogen protons in an external magnetic field, B0. The second step is to tip the magnetization from the longitudinal direction to a transverse plane by applying an oscillating magnetic B1 perpendicular to B0. The last is to measure their true relaxation back to equilibrium polarized direction. There are four important parameters to control these procedures: the length of the echo time (TE), the number of 1800 pulse (NE), the waiting time (TW) to re-polarize protons along B0 and the number of trains.
As TE decreases, spin echoes will be generated and detected earlier and more rapidly, and effective signal-to-noise ratio is increased because of the greater density of data points. As TE increase, spin echoes will be generated and detected longer, but more B0 power is required. The first two parameters determine the length of a single NMR experiment. Waiting time is the time between the ends of one CMPG sequence to the start of the next CMPG sequence. The set up the waiting time depend on the sample. In general, if we simply try to capture the full signal from all the protons present in the sample, the wait time must be set long enough that all protons returns back to their equilibrium position. Then number of trains simply as how many times the entire process is repeated. All four parameters can be controlled manually. Generally the more times experiment is repeated, the better the results should be. Usually for pure fluid, such as water, which only contains a single relaxing species, it is not necessary to use too many trains. For the fluid, such as crude oil, which contains several different relaxation hydrocarbon species, it is good to run more trains to get better results.
One of the most important steps in NMR data processing is to determine the T2 distribution that produces the observed magnetization. This step is called echo-fit or mapping, is mathematically inversion process, the total measured NMR signal is inverted from a decay curve by Echo-fit software to give T2 spectrum (Figure 3‑18).
In general, the strength of a received signal is directly proportional to the number of hydrogen protons present, which can be correlated to the amount of fluid present. The relaxation time T2 is a function of the viscosity of the fluid, or the confinement of the space where molecule is relaxing. For example heavy oil and bitumen are made of complex chains containing branches and rings, so the amount of hydrogen present in a given mass of oil will generally be less than the hydrogen present in the same mass of water. Generally the total amplitude (At) of a bitumen sample will be less than that of water of the same mass. On the other hand T2 value for heavy oil is much less than its value for water because of high viscosity of heavy oil.
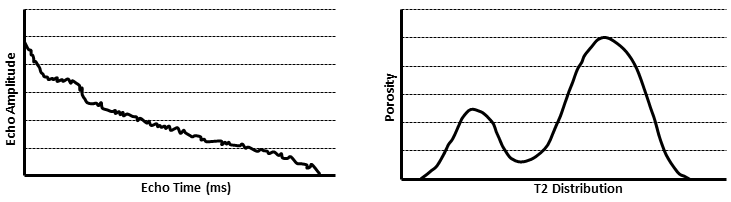
Figure 3-18: The Echo Train (Echo Amplitude as a Function of Time) is Mapped to a T2 Distribution (Porosity as a Function of T2)
In a NMR experiment, several parameters of interest are measured. The first is the total signal amplitude, which is the amplitude of both oil and solvent components. Amplitude refers to the measurable hydrogen protons in the sample and it is proportional to the sample mass. The second is amplitude index, which is simply the measurable NMR amplitude per gram of bulk fluid. Knowing the amplitude index allows for the amplitude of any given sample to be correlated to the sample’s mass:

Where,
AI = amplitude Index,
AP = amplitude of the fluid signal,
m = mass of the fluid.
Not all NMR machines are operated at the same signal gain, so the value of oil amplitude index could vary from machine to machine. In order to normalize the measured amplitude index, the term relative hydrogen index is defined[fusion_builder_container hundred_percent=”yes” overflow=”visible”][fusion_builder_row][fusion_builder_column type=”1_1″ background_position=”left top” background_color=”” border_size=”” border_color=”” border_style=”solid” spacing=”yes” background_image=”” background_repeat=”no-repeat” padding=”” margin_top=”0px” margin_bottom=”0px” class=”” id=”” animation_type=”” animation_speed=”0.3″ animation_direction=”left” hide_on_mobile=”no” center_content=”no” min_height=”none”][1]:

Where, RHI = relative hydrogen index.
Since oil and bitumen consist of different components, each with different relaxation rate, their signal will be detected with a broader relaxation range compared to pure substances with a single relaxation time like water. In other words the protons in crude oil do not all relax with a single value of T2, yielding a variety of relaxation times. The characteristic time for the oil relaxation is the geometric mean T2gm, of the oil spectrum[2]:

Where,
T2gm = The geometric mean T2 value (ms),
T2i = The T2 value of a component in the mixture (ms),
Ai = The amplitude of a component at a time constant T2i.
For a fluid like oil, which consist of multiple components, T2gm represents the mean relaxation rate for all the components.
[fusion_separator top=”25″/]
[fusion_builder_row_inner][fusion_builder_column_inner type=”1_2″ last=”no”]
<< SPIN-ECHO AND CPMG PULSE SEQUENCE
[/fusion_builder_column_inner]
[fusion_builder_column_inner type=”1_2″ last=”yes”]
APPLICATION OF LOW FIELD NMR IN DIFFUSION MEASUERMENTS >>
[/fusion_builder_column_inner][/fusion_builder_row_inner]
[fusion_separator top=”35″/]
References
[1] Y. Wen, M. Sc thesis, 2004.
[2] B. Afsahi, A. Kantzas, 2007.
Questions?
If you have any questions at all, please feel free to ask PERM! We are here to help the community.[/fusion_builder_column][/fusion_builder_row][/fusion_builder_container]