
Fundamentals of Fluid Flow in Porous Media
Chapter 5
Miscible Displacement
Fluid Phase Behavior: Pressure-Temperature Diagram (P-T Diagram)
Figure 5‑2 shows a P-T diagram for a pure component. The line connecting the triple point and critical points is the vapor pressure curve; the extension below the triple point is sublimation point. As this figure shows in pure materials, by decreasing the pressure at a fixed temperature, phase change happens just at a point (vapor pressure curve is a line). According to Figure 5‑2, the phase boundary between liquid and gas does not continue indefinitely. Instead, it terminates at a point on the phase diagram called the critical point. This reflects the fact that, at extremely high temperatures and pressures, the liquid and gaseous phases become indistinguishable.
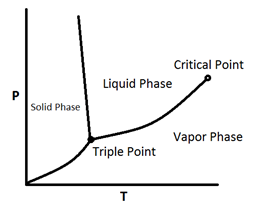
Figure 5-2: A Typical Phase Diagram for a Pure Component
The phase behavior of a multi-component system is more elaborate than that of a pure compound. the complexity generally compounds as components with widely different structure and molecular sizes comprise the system. Reservoir fluids are mainly composed of hydrocarbons with similar structure so their phase behavior is not generally highly complex. Figure 5‑3 shows an idealized P-T diagram for a multi component with a fixed overall composition. As it shows, there is a transition zone between the complete liquid phase and complete vapor phase. In other words in contrast to the pure substance, phase change from liquid to vapor happens, by decreasing the pressure at a fixed temperature, on a line. So there is a region that two phases are at equilibrium. Two phases region that is bounded by the bubble point and dew point curves is called “phase envelope”. The bubble point and dew point curves meet at the critical point. Two phases can exist at a pressure greater than critical pressure and at a temperature greater than critical temperature, unlike a pure component system. Cricondonbar for a multicomponent system is defined as the maximum pressure that two phases (vapor-liquid) can exist in equilibrium and cricondontherm is the maximum temperature that two phases can exist in equilibrium.
Figure 5‑3 shows the general behavior for a fixed composition of a system consisting of two or more components. If the composition were changed then the position of the phase envelope on the P-T plot would shift.
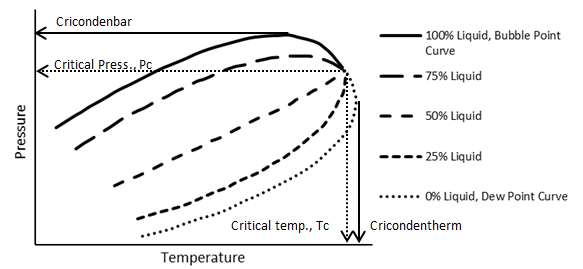
Figure 5-3: Typical P-T Diagram for a Multi-component System
Figure 5‑4.a shows the phase diagram of Ethane-normal Heptane system. As it shows, the critical temperature of different mixtures lies between the critical temperatures of the two pure components. The critical pressure, however, exceeds the values of both components as pure, in most cases. The locus of critical or “plait” points is shown by the dashed line (Figure 5‑4.a). The difference between the critical pressure of two components system and each pure component critical pressure increases by increasing the difference between the critical points of the two pure components (Figure 5‑4.b). No binary mixture can exist as a two-phase system outside the region bounded by the locus of critical points.
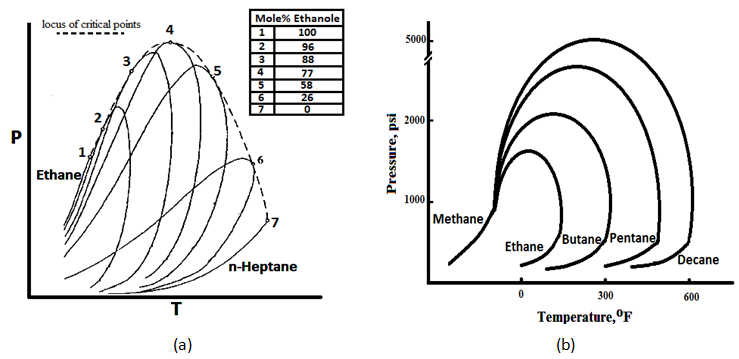
Figure 5-4: (a) Phase Diagram of Ethane-normal Heptane[fusion_builder_container hundred_percent=”yes” overflow=”visible”][fusion_builder_row][fusion_builder_column type=”1_1″ background_position=”left top” background_color=”” border_size=”” border_color=”” border_style=”solid” spacing=”yes” background_image=”” background_repeat=”no-repeat” padding=”” margin_top=”0px” margin_bottom=”0px” class=”” id=”” animation_type=”” animation_speed=”0.3″ animation_direction=”left” hide_on_mobile=”no” center_content=”no” min_height=”none”][1], (b) Critical Loci for Binary Mixture
Extracted data from the graphs such as Figure 5‑4 indicate conditions at which mixture of binary pairs are miscible. To have a miscibility of two compounds of ethane and normal pentane with any composition, at each temperature the pressure should be higher than the pressure indicated by the locus of critical pressure line for that specific temperature. At lower pressure there are possible concentrations at which the system will separate into two phases. So a minimum miscible pressure for each temperature could be determined according to graph’s data such as Figure 5‑4. For systems containing a large number of components no maps of critical points are available.
Example 5‑1[50]
A FCM miscible displacement is to be designed in which a slug of butane is the primary displacing solvent. The butane slug is to be displaced by dry gas consisting essentially of methane. Assume that the crude oil could be represented by n-decane. The reservoir conditions are 160°F and 2500 psi. Use Figure 5‑4.b to determine whether miscible conditions would exist at the front and back of the solvent (butane) slug. Is the miscible condition would be exist at p=1500 psi and T=160°F?
Solution
The primary slug is butane displacing oil. Refer to Figure 5‑4.a. the locus of critical points for C4-C10 is not given, however at 160°F and 2500 psi C4 and C10 are in liquid state. C4 and C10 will be miscible. The secondary slug is methane displacing butane. In Figure 5‑4.a at 160°F, a pressure of 2600 psi is well above the locus of critical points for C1-C4 mixtures. Therefore C1 and C4 will be miscible. So at 160°F and P=2500 psi proposed displacement will be miscible at both the leading and trailing edges.
If the reservoir pressure was 1500 psi then the displacement of butane by methane would be at conditions below the critical locus. At this condition, at some points in the process two phases would form and the dry gas would displace butane immiscibility at reduced microscopic displacement efficiency. So some amount of the butane may be bypassed during the displacement by dry gas and trapped in the reservoir. This would result in a relatively rapid degradation of the integrity of the primary butane slug and drastically influence oil production.
[fusion_separator top=”25″/]
[fusion_builder_row_inner][fusion_builder_column_inner type=”1_2″ last=”no”]
[/fusion_builder_column_inner]
[fusion_builder_column_inner type=”1_2″ last=”yes”]
PRESSURE-COMPOSITION DIAGRAM >>
[/fusion_builder_column_inner][/fusion_builder_row_inner]
[fusion_separator top=”35″/]
References
[1] “PVT and Phase Behavior of Petroleum Reservoir Fluids”, A. Danesh, 2003
Questions?
If you have any questions at all, please feel free to ask PERM! We are here to help the community.[/fusion_builder_column][/fusion_builder_row][/fusion_builder_container]