
Fundamentals of Fluid Flow in Porous Media
Chapter 2
Relative Permeability
Three Phase Relative Permeability: Methods of Relative Permeability Measurements
Unsteady state is the quickest method of obtaining relative permeability. In this method, the in-situ fluids are displaced at a constant rate with the effluent volumes being monitored continuously. Equilibrium is not achieved, so the entire set of relative permeability curves can be obtained in a few hours. However, there are many difficulties associated with this method, such as capillary end effects, viscous fingering and channeling in heterogeneous medium, which cannot be properly accounted for.
Capillary end effect is a phenomenon in which the saturation is high at the inlet or outlet of the core. To minimize the boundary effect, the fluids can be flowed through the core at high rates to make the capillary forces insignificant compared to the viscous forces due to the flow of fluids. The fluid dispersion in the porous media increases with the flow rate, thus minimizing the boundary effect at the input end6. However, the use of high flow rate can aggregate viscous fingering problems. Also, in this method viscous oils are usually used to prolong the period of two-phase production (at flow breakthrough, no more information on relative permeability can be obtained). Again, this will further enhance the viscous fingering problem.
Craig and other researchers recommend that the unsteady state method not be used with strongly water wet cores. They believe that the combination of high velocities and high viscosities will cause a strongly water wet medium to behave as an oil wet system during waterflood. During a waterflood, the injected water will move rapidly through the larger pores, bypassing a large number of pores that are filled with viscous oil, causing early breakthrough. Usually, in waterflooding of an oil wet system, it was seen that breakthrough recovery is low and additional oil can still be recovered. Thus, the performance of a waterflood with viscous oil is very similar to a waterflood of an oil wet system. Also, in comparison with the steady state relative permeability of two-phase, the calculated unsteady state relative permeabilities measured on the same core appear to be more oil wet.
During the process of core cleaning and handling, the wettability of the core can be altered, which can significantly affect the relative permeability. The cleaned core is usually more water wet than the actual native state wettability, thus the most accurate relative permeability measurements are obtained on native state core when the core’s wettability is reserved. When these cores are not available, restored state core could be used. The process of core wettability restoration must be handle with care since any error can be resulted in significant wettability alteration.
There are other problems associated with obtaining data from core. Heaviside et al. said that the core sample might not truly represent the reservoir because the core samples are only a small fraction of the reservoir, and may therefore be statistically unrepresentative[fusion_builder_container hundred_percent=”yes” overflow=”visible”][fusion_builder_row][fusion_builder_column type=”1_1″ background_position=”left top” background_color=”” border_size=”” border_color=”” border_style=”solid” spacing=”yes” background_image=”” background_repeat=”no-repeat” padding=”” margin_top=”0px” margin_bottom=”0px” class=”” id=”” animation_type=”” animation_speed=”0.3″ animation_direction=”left” hide_on_mobile=”no” center_content=”no” min_height=”none”][7]. Also, the sample may not be in the same state or have the same properties as when it was in the undisturbed reservoir. When the core plug is brought up to the surface, the light ends hydrocarbon can be liberated, causing the oil to be more heavy[7]. Some components can be deposited on the pore surface, making the rock more oil wet.
Three-Phase Relative Permeability Correlations
Due to the complex nature of the experimental process to obtain three-phase relative permeability data, many models were developed to predict these values instead. These models can be divided into three catagories: those that are based on bundle of capillary tubes theory, those that are based on channel flow theory (Stone’s methods and their modifications), and other miscellaneous models.
Bundle of capillary tubes theory
There are many models which used this theory in the derivation of the relative permeability model. The models that will be discussed are Corey et al., Naar and Wygal, and Land.
Corey, Rathjens, Henderson and Wyllie
The first model of three-phase relative permeability was published by Corey et al. in 19563. The model assumed that fluid flow in reservoirs can be represented by a bundle of capillary tubes. The flow paths through the medium can be approximated by the equivalent hydraulic radius of the capillary tubes. A tortuosity correction was included to account for the differences in path length of tubes of different sizes. Corey’s model also assumed that the wetting and nonwetting phase relative permeabilities are independent of the saturations of the other phases. In other words, relative permeability of the wetting phase is a function of wetting phase saturation and relative permeability of nonwetting phase is a function of nonwetting phase saturation.
In this model, the intermediate wetting phase ( oil ) occupies the pores between those occupied by water and gas which are intermediate in size. Its flow can be interfered with by both the wetting and nonwetting fluids. Relative permeability of the intermediate wetting phase is proportional to the area of the pores occupied by this phase relative to the pores occupied by other phases. Corey also assumed that the relationship between saturation and drainage capillary pressure is represented by,
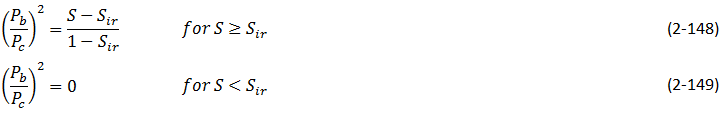
Where,
Pb = fitting parameter
Pc = capillary pressure
S = saturation
Slr = residual liquid saturation for gas oil displacement ( obtain from experiment )
The model for the intermediate wetting phase ( oil ) is given as:

Where,
Sl = total liquid saturation
Sw = water saturation
The derivation for this model is based on the hypothesis that the residual oil saturation of a system containing water > = Slr will be zero.
Corey compared the values calculated from his model to the experimental values which he collected from experiment on Berea sandstone. This is shown on Figure 2‑86.
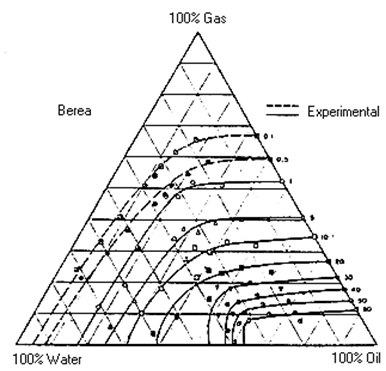
Figure 2-86: Comparison Between Experimental and Predicted Values (After 3)
Figure 2‑86 shows that the match is quite good.
One advantage of this method is that it requires only the value of residual liquid saturation to predict the oil relative permeability. However, this model does not allow for the adjustment of the end points of relative permeability in oil-gas and oil-water system. Therefore, its estimation of these end point relative permeabilities may be very different from the values obtained from the experiments.
Naar and Wygal
This model for imbibition was published in 1961[8]. It is also based on the concept of flow in straight capillaries. It has random interconnections of pores and storage capacity, which makes trapping of the nonwetting phase by the invading wetting fluid possible. Again, relative permeabilities to the wetting and nonwetting phases are considered to depend only on their own wetting and nonwetting phase saturations, while the intermediate phase relative permeability depends on all three-phase saturations. The relative permeability to water (wetting phase) can be obtained by assuming that oil and gas combine to form a single nonwetting phase; thus the system is two-phase. To compute the relative permeability to gas, the system can be treated as a two-phase system with water and oil forming the single wetting phase. The relative permeability to oil is more complex. When the water invades the porous medium, part of the oil is blocked and the rest invades the pores that are full of gas. However, some of the gas phase is blocked while the remainder is pushed out. Because some of the oil is trapped, the relative permeability of oil decreases. In this model, the oil phase is more wetting than the gas phase, thus oil exists in smaller pores than gas does. So oil will invades gas in slightly larger pores first. Since some oil moves from small pores into larger pores, the permeability of oil increases.
This model was derived by assuming that the capillary pressure curve is approximated by

Where C is a constant and S* is the reduced saturation.
The relative permeability of the intermediate wetting phase can be predicted by:
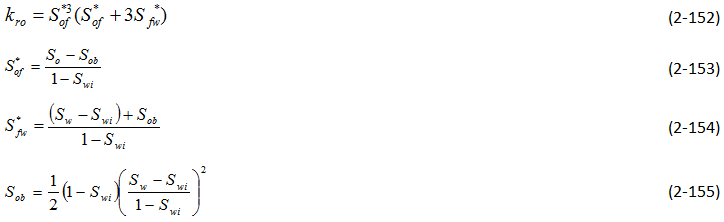
Where,
So = oil saturation
Swi = initial water saturation
Sw = water saturation
At the time of the model’s development, Naar and Wygal did not compare the model predictions with any experimental data.
Land
Land has seen some evidence showing that the initial gas saturation controls the residual gas saturation, which is trapped after imbibition[9]. Residual gas saturation was seen to increase with increasing initial gas saturation. When the initial gas saturation is unity (ie. the reservoir contains only gas), the residual gas saturation is a maximum.
Land published a model for imbibition in 1968, which takes into account the effect of initial saturations. This model assumes that the maximum residual hydrocarbon saturation is constant, whether the hydrocarbon is gas or oil, and that the residual hydrocarbon is related to the initial hydrocarbon saturation.
Land assumed that in three-phase systems the gas relative permeability is the same as for two-phase systems. He reasoned that this is because the gas is a nonwetting phase, thus it occupies the same pores regardless of the nature of the liquids present. Also, it was assumed that for a water wet medium, the imbibition relative permeability to water is the same function of water saturation for both two- and three-phase systems.
Land’s model is very similar to that of Naar and Wygal. However, Land believed that Naar and Wygal wrongly placed trapped the gas in the largest pores rather than the smaller pores which are likely to be invaded first by the wetting phase. Land’s model also includes the dependence of relative permeability on saturation, saturation history and the capillary pressure.
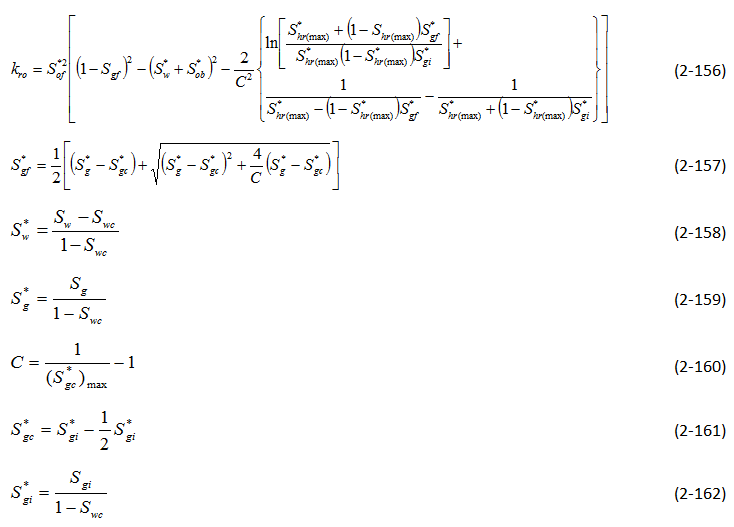
Where
( S*gc )max = residual gas saturation after imbibition process which started with 100% gas
( S*hr )max =normalized maximum trapped hydrocarbon saturation
( S*ob is defined earlier in Naar and Wygal)
If water saturation increases and oil saturation decreases while the gas saturation remains constant (or is increasing), the main equation simplifies to

When all gas in the porous medium is trapped,

Land did not compare this model’s prediction with any experimental values.
Parker, Lenhard, and Kuppusamy
This model was developed in 1987 and it is very similar to Corey’s[10]. However, in this model the flow path is assumed to be proportional to the square of the mean hydraulic radius of the pores occupied by that phase.
In this model,

With
m = 1 – ( 1 / n )
S*l = normalized liquid saturation
The fitting parameter n can be obtained by a curve fit of capillary pressure or by fitting two-phase relative permeability. Therefore this model will tend to give good results for cases where there is a satisfactory fit of the two-phase data.
Stone’s Methods (and their modifications)
The methods proposed by Stone are the ones most commonly used for prediction of three-phase relative permeability. Many people have attempted to improve the estimations of Stone’s methods.
Theory and assumptions used in Stone’s models: Stone’s method 1 and 2 are probability based models[11], [12]. Both methods are based on the channel flow theory, which states that in any flow channel there is at most only one mobile fluid. As a consequence, the wetting phase is located in the small pores and the nonwetting phase in the large pores, and the intermediate phase occupies the pores in between. Thus at equal water saturations the fluid distributions will be identical in a water-oil system and in a water-oil-gas system, as long as the direction of change of water saturation is the same in both. This implies that water relative permeability and water-oil capillary pressure in the three-phase system are functions of water saturations alone. Also, they vary the same way in the three-phase system as in the two-phase water oil system. The gas phase relative permeability and gas oil capillary pressure are the same functions of gas saturation in the three-phase system as in the two-phase gas oil system.
These two models require two sets of two-phase data: water oil displacement and gas oil displacement. Hysteresis can be taken into consideration by using the appropriate two-phase data.
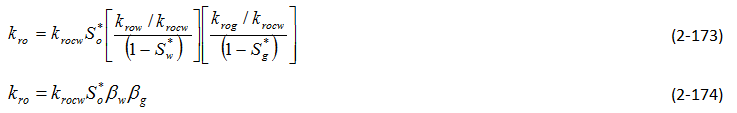
Stone’s Method 1
This method was published in 1970[11]. It assumes that the flow of oil is interfered with by the presence of gas and water, and that the effects of gas and water are independent. Oil relative permeability is a function of normalized oil saturation S*o, βw and βg, which depend on the water and gas saturation, respectively.
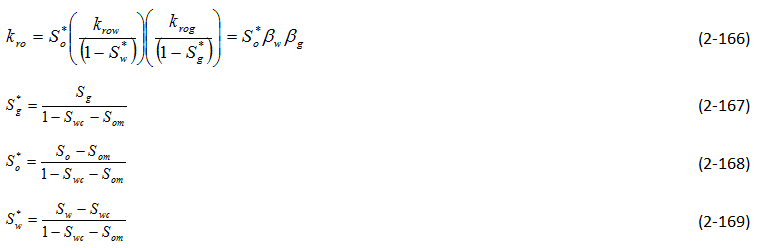
Where,
βw = probability that an oil filled pore is not blocked by water
βg = probability that an oil filled pore is not blocked by gas
krow = relative permeability of oil in oil water system
krog = relative permeability of oil in oil gas system
Som = minimum residual oil saturation
Sg = gas saturation
So = oil saturation
Sw = water saturation
Swc = connate water saturation = Swir = Swi
Stone mentioned that Som can be expressed as a function of fluid saturation but since sufficient data is not available to correlate this relationship, a constant value is set for Som instead.
Stone compared the simulated values from the model with the data of Corey et al. and Dalton et al. (see Figure 2‑87 and Figure 2‑88).
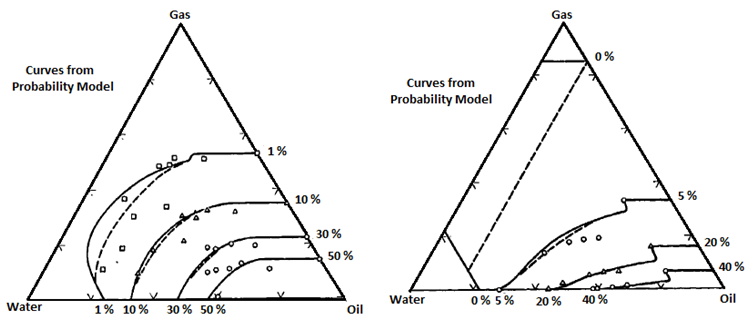
Figure 2-87 (left): Compare With Results of Corey et al. (After 11); Figure 2-88 (right): Compare With Results of Dalton et al. (After 11)
In Figure 2‑87 and Figure 2‑88, the dashed curves are obtained with Som = 0.1, while the solid curves correspond to Som = 0. From the figures it can be seen that the value of Som only has an affect on the small values of relative permeability. Also, data obtained by Corey et al. has significant scattering, so it is hard to say whether the match is good or not. Overall, Stone’s method 1 fits the data of Dalton et al. better than Corey et al.’s data.
Stone’s Method 2
In the three-phase system, the sum of all three relative permeabilities is always less than or equal to unity. Stone assumes that it achieves its maximum value in the cases where So = 1 – Swc,
Sw = Swc and Sg = 0 and So = 1 – Sgc, Sw = 0, Sg = Sgc. For these cases, kro = 1 and krg = krw = 0[12].

Where,
krow = relative permeability of oil in oil-water system
krwo = relative permeability of water in oil water system
krog = relative permeability of oil in oil gas system
krgo = relative permeability of gas in oil gas system
Stone claimed that this method predicts better values than method 1, especially at low oil saturations. It is also not required to estimate Som in this method; the model can predict the value of Sor.
Comparison of Stone’s method 2 predictions with Corey et al.’s data is shown in Figure 2‑89.
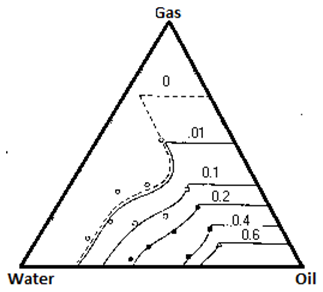
Figure 2-89: Stone’s Method 2 Predictions and Core et al.’s Experimental Data (After 12)
At low water saturation, the agreement is good. However, at higher water saturation, the predicted values are too low.
Stone also compared the predicted Sor with Holmgren-Morse residual oil data of sandstone, see Figure 2‑90.
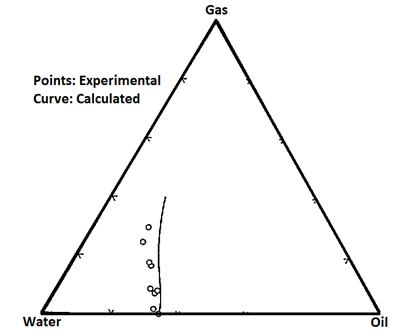
Figure 2-90: Stone’s Prediction of Sor and Holmgren-Morse’s Data (After 12)
These data shows that as the initial free gas saturation increases, residual oil saturation decreases and residual gas saturation increases. Stone’s method 2 consistently predicts higher Sor.
Dietrich and Bondor
It has been observed in experiments on water-wet systems that the water relative permeability is approximately a function of water saturation only, and that the gas relative permeability is a function of the gas saturation. However, the oil relative permeability seems to be a function of both the water and gas saturation. This model (proposed in 1976) takes into account the reduction in oil relative permeability caused by the presence of water and gas[13].
Dietrich and Bondor realized that the oil permeability at connate water saturation predicted by Stone’s method 2 would be applicable only if krow and krog can be one. However, this is not always possible. Thus, they rewrite the Stone’s model as,

Where krocw is the relative permeability of oil at connate water in oil water system.
Hirasaki
Hirasaki modified Stone’s method 1 in 1973[13]. Hirasaki’s model assumes that both water and gas may be flowing simultaneously in the pore space with the oil. He derives a three-phase oil relative permeability expression by considering the total reduction in oil relative permeability caused by the water and gas.

Aziz and Settari
This model was published in 1979[10]. Aziz and Settari suggested the use of the absolute permeability as the basis for calculating relative permeability and use krocw as a partial normalizing factor.
For method 1:
For method 2:

Aziz and Settari said that Stone’s method 2 usually predicts too low oil permeabilities and method 1 usually predicts too high oil permeabilities. They believed that the use of α as a free parameter is a convenient way to improve the predicted permeability.
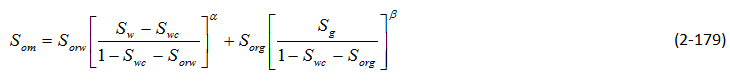
Fayers and Mathews
This model was published in 1984[14]. Fayers and Mathews believed that the value of Som should be better predicted to improve the estimations of Stone’s method 1 ( Som is a constant in Stone’s method 1 ). They suggested the use of a saturation dependent value of Som for Stone’s method 1,
In the presence of trapped gas,

Where,
Sorg = residual oil saturation in gas oil system
Sorw = residual oil saturation in water oil system
Baker said that this provides an improved fit to the residual oil data.
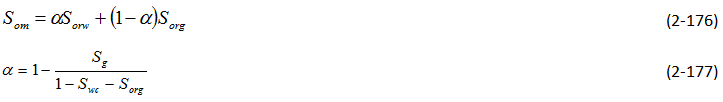
Aleman
In 1986, Aleman suggested another approximation of Som for Stone’s method 1[10].
The free parameters α and β are used to fit the curvature of the zero oil permeability isoperm.
Aleman et al. later developed a statistical structural model for prediction of two-phase relative permeability based on a local volume average approach to a bundle of capillaries model[15]. In this model, pores are randomly distributed but there are no pore interconnections. It assumed that the saturation change is in the direction of decreasing intermediate wetting phase saturation. All other assumptions are the same as the ones made by Stone in the development of his methods. Aleman expanded this model for three-phase flow with the intermediate wetting phase relative permeability:

Where kro( I ) is the relative permeability to oil predicted by Stone’s method 1 and Δ is a correction term.

Where k*row = ( krow ) / ( 1 – S*w ) , and other parameters such as k*rog, k*rwo, k*rgo are defined in a similar way.
This model is sensitive to the value of Som, and may predict incorrect oil permeabilities for values of Som which are too small. The problem may be due to assumptions made in the model about the distributions of fluids. Larger values of Som give more reasonable predictions. Aleman recommended that this model should be used only if the predicted isoperms shows reasonable match with experimental data.
Other Methods
Other methods included in this report are the models that were proposed by Baker, Pope, Blunt, and Moulu et al.
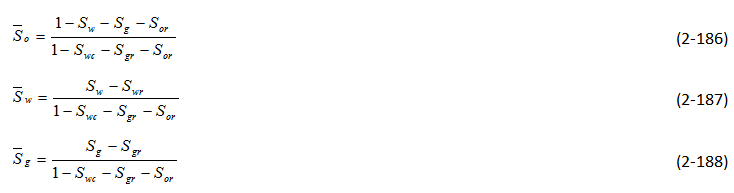
Saturation-Weighted Interpolation
This method was proposed by Baker in 1988[10]. This is a simple model of oil relative permeability that is based on saturation-weighted interpolation between water-oil and gas-oil data.

For the wetting and nonwetting phase,
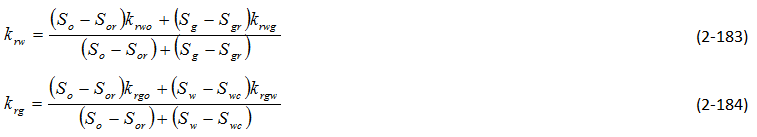
These equations assume that the end points of the three-phase relative permeability isoperms coincide with the two-phase relative permeability data.
The saturation-weighted interpolation method may give erroneous results if the two-phase relative permeability curves being interpolated between are very different. This is especially a problem if the end point saturation ( Sorw and Sorg ) of the oil-water and oil-gas curves differ significantly.
Pope
Pope published his model in 1988[16]. This model does not require two-phase data:

Where,
Where Sgr is the residual gas saturation.
The parameters α, β, γ, δ and a can be obtained by matching the two-phase data, such that
γ = α + β = eow, α = γ + δ = eog, and a=1/2. eow and eog are obtained by curve fitting the oil-water and oil-gas relative permeability data sets into exponent functions.
Empirical Model
This model was developed by Blunt and published in 2000[17]. It is based on the saturation-weighted averages of the two-phase relative permeabilities, which includes gas and oil trapping. The model also allows for drainage of oil at low saturations.
In this model, six relative permeability sets are required: krwo and krow from oil-water displacement, krog and krgo from gas-oil displacement, and krgw and krwg from gas-water displacement.
If the medium is water wet or mixed wet and oil is spreading then layer drainage is also considered. In this case, the bulk oil relative permeability, kob, is obtained by:
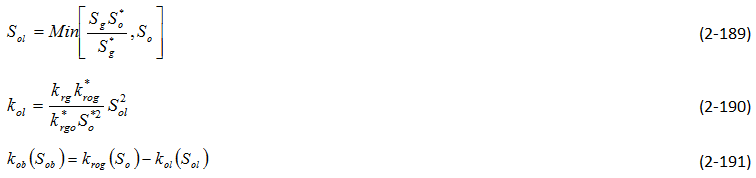
Sol represents the oil saturation in layer. S*o is the saturation of oil when the layer drainage regime starts, and k*rog is the corresponding oil relative permeability. If experimental data does not indicate layer drainage, it is assumed that S*o = Sorw. S*g is the gas saturation when So = S*o ( all oil resides in layers ). Note that S*o and S*g in this model are defined differently than before.
If the medium is not at the condition described above, then kob = krog( So ).
When trapping is considered:
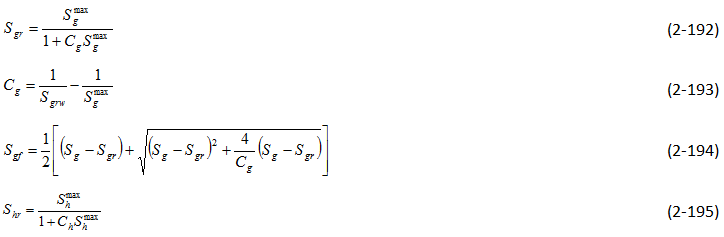
Smaxh is the largest hydrocarbon saturation during displacement
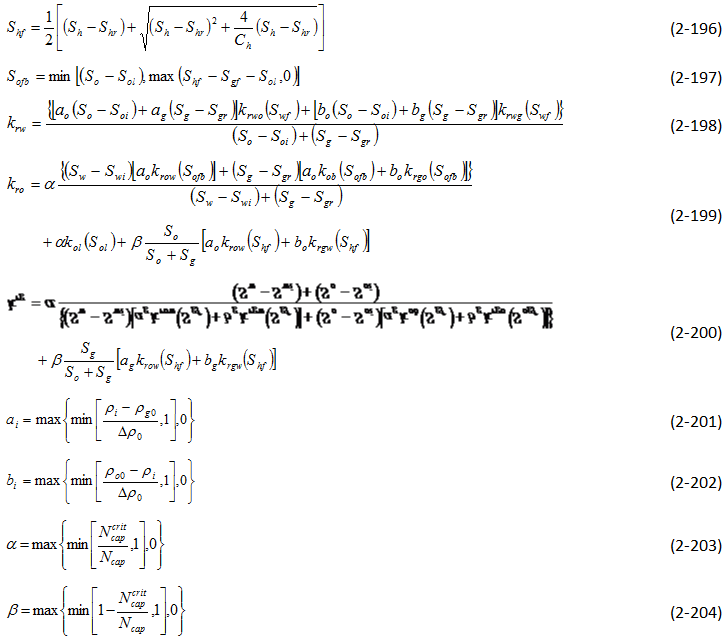
Where,
ρo0 = reference oil density
ρg0 = reference gas density
Δρ0 = reference density different between oil and gas
Ncritcap = critical capillary number
Ncap = capillary number
Ch is the Land trapping constant for hydrocarbon. In strongly water wet medium, it can be assumed that Ch = Cg = Co. In other cases, it can be assumed that Ch = min ( Co , Cg ).
Mathematical Model
Moulu et al. developed a mathematical model to simulate the three-phase flow in porous media in 1999[18]. The model assumes that the reservoir consists of fractal pores with gas in the center, and in the case of water wet pores, the water is residing near the wall. A fractal is defined as a shape made of parts similar to the whole in some way. This model assumes that krw is a function of Sw only and krg is a function of Sg and Sw. Essentially in this model:
- The fluids flow together in the same fractal pore with the wetting phase along the rock walls, the gas phase in the center and the third phase in between
- The flow of each fluid is given by their relative permeabilities, which are analytical functions of a linear fractal dimension DL
- Capillary pressure is taken into account when calculating the relative permeabilities by using DL
DL is the slope obtained from log-log plot of the capillary pressure curve. This plot will give two different slopes. The sharp slope is used for the wetting phase flow ( krw ) at the wall and for the intermediate phase ( kro ). The other slope is use for gas flow ( krg ).
For a water wet medium:
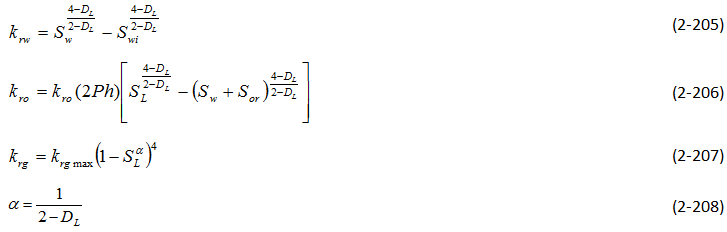
For cases when the medium is not water wet,

Where Soi = initial oil saturation
The expression for gas relative permeability can still be used in this case since gas always shows its strongly nonwetting phase behavior.
It is important to note that the values of DL used in krw ( and kro ) and krg are different.
Comparison
There are many correlations available for the prediction of three-phase relative permeability. These include the models of Stone, Hirasaki, Corey et al, Naar and Wygal, Land, Aleman, and Parker et al. The comparison by Baker shows that the models are often not very good predictors of the experimental data[10]. This means that there is a need for better relative permeability models of three-phase flow. Baker has shown that in most cases, saturation weighted interpolation between the permeabilities at the two-phase data set provided a better fit of the experimental data than other models. Baker has seen that most of the prediction methods fit the data sets equally well. This shows that each of the methods is capable of representing three-phase relative permeabilities in the high oil permeability region. Stone’s method 1, using saturation-weighted interpolation fits better than Stone’s method 2 for most cases. Hirasaki’s model is one of the worse. Parker’s model is generally equal to or better than Corey’s, Land’s, Naar and Wygal’s, and Aleman.
Stone’s method 1 usually predicts too high oil permeability at low oil saturation, while Stone’s method 2 predicts too low oil permeability in the same region. With better values Som or α the predictions of Stone’s method can be improved. However, the value of Som or α are not always easily determined. Thus, saturation-weighted method seems to be a good model due to its simplicity and its ability to yield comparable results with Stone’s methods.
Delshad and Pope claim that the model proposed by Pope agrees with several sets of data, which makes it more superior than other methods (Corey, Naar-Wygal, Land, Stone’s, Baker and Parker).
A comparison of all the methods presented is not seen in the literature, thus it is not known which method is most superior[16].
[fusion_separator top=”25″/]
[fusion_builder_row_inner][fusion_builder_column_inner type=”1_2″ last=”no”]
<< DRAINAGE AND IMBIBITION RELATIVE PERMEABILITIES
[/fusion_builder_column_inner]
[fusion_builder_column_inner type=”1_2″ last=”yes”]
EFFECTS OF LOW IFT OR NCA ON RELATIVE PERMEABILITY >>
[/fusion_builder_column_inner][/fusion_builder_row_inner]
[fusion_separator top=”35″/]
References
[7] Heaviside, J., Brown, C.E., and Gamble, I.J.A., “Relative Permeability for Intermediate Wettability Reservoirs”, SPE 16968.
[8] Naar, J. and Wygal, R.J., “Three-Phase Imbibition Relative Permeability”, Trans., AIME (1961) 222, 254-258.
[9] Land, C.S., “Calculation of Imbibition Relative Permeability for Two- and Three-Phase Flow From Rock Properties”, SPE 1942.
[10] Baker, L.E., “Three-Phase Relative Permeability Correlations”, SPE 17369.
[11] Stone, H.L., “Probability Model for Estimating Three-Phase Relative Permeability”, SPE 2116.
[12] Stone, H.L., “Probability Model for Estimating Three-Phase Relative Permeability and Residual Oil Data”, SPE 19439.
[13] Dietrich, J.K. and Bondor, P.L., “Three-Phase Oil Relative Permeability Models”, SPE 6044.
[14] Fayers, F.J. and Mathews, J.D., “Evaluation of Normalized Stone’s Methods for Estimating Three-Phase Relative Permeabilities”, Society of Petroleum Engineers Journal (April 1984) 24, 225-232.
[15] Aleman-Gomez, M., Rmamohan, T.R. and Slattery, J.C., “ A Statistical Structural Model for Unsteady-State Displacement in Porous media”, SPE 13265.
[16] Delshad, M. and Pope, G.A., “Comparison of the Three-Phase Oil Relative Permeability Models”, Transport in Porous Media 4 (1989), 59-83.
[17] Blunt, M.J., “An Empirical Model for Three-Phase Relative Permeability”, SPE 67950.
[18] Moulu, J.C., Vizika, O., Egermann, P. and Kalaydjian, F., “A New Three-Phase Relative Permeability Model For Various Wettability Conditions”, SPE 56477.
Questions?
If you have any questions at all, please feel free to ask PERM! We are here to help the community.[/fusion_builder_column][/fusion_builder_row][/fusion_builder_container]