Fundamentals of Fluid Flow in Porous Media
Chapter 4
Immiscible Displacement
Water Injection Oil Recovery Calculations
Before water breakthrough ( t= tbt ) in the producing face/well, eq. (4‑18) can be applied to determine the positions of planes of constant water saturation, for Swƒ < Sw < 1 – Sor, as the flood moves through the reservoir, and hence the water saturation profile. At the time of breakthrough and subsequently, this equation is used in a different manner, to study the effect of increasing the water saturation at the producing well. In this case x = L, the length of the reservoir block, which is a constant, and eq. (4‑18) can be expressed as:

Where,
PVI = Injected Pore Volume (dimensionless)
Swe = Water saturation at the end (producing) face
Using equation (4‑19), someone can find the saturation at the producing face after the breakthrough time. Before this time Swe = Swi, and at the breakthrough time it is equal to the Swƒ and then it increased with time. Before breakthrough occurs the oil recovery calculations are trivial. For incompressible displacement the oil recovered is simply equal to the volume of water injected, there being no water production during this phase. At the time of breakthrough the flood front saturation, Swƒ = Swbt, reaches the producing well and the reservoir watercut increases suddenly from zero to ƒwbt = ( ƒw )swbt a phenomenon frequently observed in the field and one which confirms the existence of a shock front. At this time (breakthrough time) produced pore volume of the oil can be calculated as follows:

Where,
Npd = Produced pore volume of oil,
Npdbt = Produced pore volume of oil at breakthrough time.
After breakthrough, L remains constant in eq. (4‑32) and Swe and ƒwe, the water saturation and fractional flow at the producing well, gradually increase as the flood moves through the reservoir. During this phase the calculation of the oil recovery is somewhat more complex and requires application of the Welge equation, for average saturation of a segment of porous medium:
Welge Equation – Average Saturation in a Segment of Porous Medium
The average saturation between two points, x1 and x2, behind the front in a linear system with uniform A and φ is:

The integral in the numerator of this equation can be evaluated using the method of integration by parts, i.e.

to give:

The value of x in the last term of the above equation can be related to Sw by the frontal advance equation:

Substituting eq. (4‑18) for x in eq. (4‑35) gives:

Average saturation between two cross sections at x1 and x2, could be found by substituting eq. (4‑37) into eq. (4‑34):

The above equation can be used to relate the average saturation in any segment of the linear system to the saturations at the two ends of that segment. If we consider the situation after breakthrough and take x1 to be the injection face ( x1 = 0, ƒw1 = ƒwin ) and x2 to be the production (end) face ( x2 = L, Sw2 = Swe, ƒw2 = ƒwe ), we can write an expression for the average saturation in the system as:

In the above equation, ƒwin is the fractional flow of water at the injection face, which would always be equal to 1. Hence:

Frontal advance equation can be used to relate the value PVI to saturation at the outflow end. The axial position of the saturation Sw2, which is now at the producing end, is given by eq. (4‑18):

Or:

Substituting eq. (4‑42) in eq. (4‑40), we get:

This is the Welge equation that relates the saturation at the end (producing) face to the average saturation in the linear system.
Subtracting Swc = connate water saturation, from both sides of eq. (4‑43), and using eq. (4‑33) gives the oil recovery equation:

Where, Npd is dimensionless pore volume oil production.
The following steps show the procedure for calculating waterflood performance using the frontal advance equation:
- Draw the fractional flow curve ( ƒw vs. Sw ), using eq. (4‑7) and appropriate relative permeabilities and viscosities (as mentioned previously capillary pressure is neglected in developing this equation).
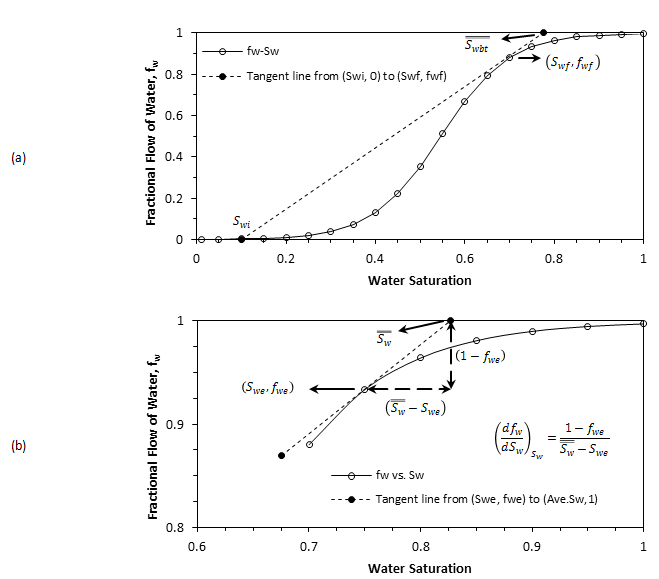
- To find the front saturation and water fraction, draw the tangent to this curve ( ƒw vs. Sw ) from the point: Sw = Swc , ƒw = 0. As described in the previous section, the point of tangency has the co-ordinates: Sw = Swƒ = Swbt , ƒw = ( ƒw )Swƒ = ƒwbt.
- Determine the average saturation behind the front (and at breakthrough time) by extrapolation of tangent line at front point to ƒw = 1.
- Using eq. (4‑33) to calculate breakthrough recovery.
- Use eqs. (4‑32) and (4‑40) to calculate the values of average saturation ( Sw ) and Npd values corresponding to a bunch of selected Swe values that are higher than Swƒ.
- Calculate the corresponding recovery using eq. (4‑44).

Figure 4-13: Application of the Welge Graphical Technique to Determine: (a) The Front Saturation, (b) Oil Recovery After Breakthrough
Questions?
If you have any questions at all, please feel free to ask PERM! We are here to help the community.
