Fundamentals of Fluid Flow in Porous Media
Chapter 3
Diffusion Coefficient: Measurement Techniques
NMR Method: Application of Low Field NMR in Diffusion Measurements
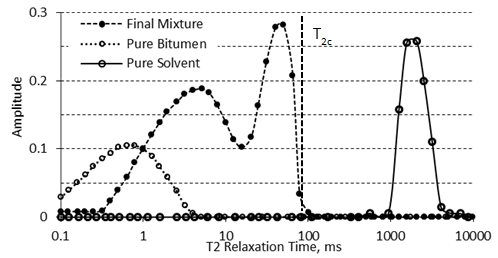
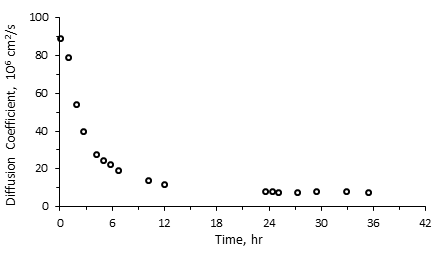
The basis for using NMR is the fact that the relaxation spectra of a heavy oil or bitumen are distinctly different than those of a solvent From Figure 3‑19, it is evident that during the diffusion of a solvent in bitumen the solvent spectrum shifts to faster relaxation times by increasing its viscosity during the mixing, while the bitumen spectrum shifts to longer relaxation times by decreasing of its viscosity. Two separate peaks of pure heavy oil/bitumen and solvent become one continuous multi-peak spectrum. It is assumed that the amount of solvent in bitumen is proportional to the expansion of the spectrum of the bitumen component (see Figure 3‑19). If this assumption is correct, then there will be a critical relaxation time that will split the mixture spectrum into two components. Spectrum peaks with relaxation times faster than the critical relaxation time will correspond to bitumen and diffused solvent. Spectrum peaks with relaxation times slower than the critical relaxation time will correspond to pure solvent that has not yet diffused in bitumen. It then becomes important to define this critical relaxation time, T2c. T2c is defined as the maximum relaxation time observed in a thoroughly mixed solvent/bitumen mixture, which is shown in Figure 3‑19. Usually, the spectra of heavy oil and bitumen are less than 10 ms, the spectra of solvents are beyond 1,000 ms, and the spectra of the mixtures of solvent with heavy oil or bitumen extend to some intermediate value. For bitumen-solvent system of Figure 3‑19, the signal under the 100 ms was considered to be solvent diffusing in the bitumen, in other words the signal amplitude change up to 100 ms was attributed to solvent mass transfer. The signal beyond the 100 ms was considered to be pure solvent. Prior to starting the experiment, mixtures of known percentages of bitumen and solvent are prepared and the correlation between the NMR parameters and the concentration of bitumen in the mixture is determined (NMR parameters calibration with bitumen content). These correlations were used to calculate the concentration of the solvent that diffused in the heavy oil or bitumen during the test (Figure 3‑20). Where, msb = Mass of diffused solvent, Asb = Bulk solvent signal amplitude, AIs = Pure solvent amplitude Index. The mass of diffused solvent could be calculated as: Where, ms = Mass of initial pure solvent, msd = Mass of diffused solvent. The total amplitude of diffused solvent is calculated using the following relation: Where, As = Total pure solvent amplitude, Asb = Total bulk solvent amplitude. The combined amplitude index for the diffused solvent and bitumen/oil is calculated, using amplitude index definition: Where, Adb = Signal amplitude of diluted bitumen, mb = Mass of pure bitumen, msd = Mass of diffused solvent, AIdb = Amplitude index of diluted bitumen. As the next step, geometric mean relaxation time for the diluted bitumen, T2gm, is calculated according to eq. (3‑34). The solvent content (concentration) could be calculated form the generated correlation between NMR properties and bitumen content (such as Figure 3‑20) at different times. The concentration of solvent determined through NMR spectra change is the overall concentration, C, in the mixture area, which is a function of time and diffusion coefficient. The correlation between concentration C, time t, and D is described in the following equations: At given t: As a result of eq. (3‑41), one can construct models of C with D and t, and pursue estimates of the diffusion coefficient. In the NMR test, it is assumed that the D value is constant during each small time interval. So the following equation could be used for the determination of the diffusion coefficient: Where, Co = Starting concentration, t = the time of measurement, x = the equilibrium distance for the early times (for example first two days) of measurements, D = the diffusion coefficient that gives the best fit. Since there is no ability to obtain the correlation between concentrations with distance from NMR spectra, an overall constant diffusion coefficient is considered from the analysis of NMR data. x is determined independently using X-Ray CAT scanning. The reason for using early time data is because the interface between solvent and heavy oil/bitumen can only be maintained stable for a short time. That was the observation made from CAT scanning experiments[3]. Figure 3‑21 shows a sample result of diffusion coefficient calculated using NMR experiment. Afsahi and Kantzas (2007) used the same method to find the diffusion coefficient in sand-saturated sample. They mixed the bitumen with sand thoroughly in a way that the final mixture of sand and bitumen had almost 35 to 40% porosity (40% bitumen, 60% sand). Then the bitumen-sand mixture was placed in the vial and compacted completely. Solvent was placed on top of oil-saturated sand in the vial. In order to keep the sand in place after dilution of heavy oil by the solvent they used a nylon mesh to separate the oil-saturated sand from the solvent. NMR measurements were taken frequently and changes in the spectra were related to the change of oil and solvent properties as solvent diffused into the oil-sand matrix. Another step of the procedure was the same as for the bulk diffusion that explained earlier. Another interesting usage of NMR method, such as pore size distribution or wettability determination, will be illustrated later. [1] Y. Wen, J. Bryan, and A. Kantzas, 2003. [2] D. Salama and A. Kantzas, 2005. [3] Y. Wen, A. Kantzas, and G.J. Wang, 2004. If you have any questions at all, please feel free to ask PERM! We are here to help the community.
Figure 3-19: Typical NMR Spectrum for Pure Bitumen, Pure Solvent, and a Mixture


Figure 3-20: Two Samples of NMR Calibration for Bitumen-Solvent Mixture[2],[3]


Figure 3-21: Diffusion Coefficient as a Function of Time, NMR Experimental ResultReferences
Questions?
