Fundamentals of Fluid Flow in Porous Media
Chapter 3
Diffusion Coefficient: Measurement Techniques
Computer-Assisted Tomography
Computer-assisted Tomography (CAT) scanning using X-ray has been extensively used in research laboratories around the world for reservoir rock characterization and fluid flow visualization.
Principles of CAT Scanning and Processing[1]
X-rays lose their energy as they pass through a medium, and this reduction depends on the density of the substance and the path length through that substance. CAT is based on emitting x-rays from a source which revolves around the object in consideration while one-dimensional projections of attenuated x-rays are collected by a detector on the other side of the source. These projections are collected as the sample travels through the scanner longitudinally and are used to reconstruct a two-dimensional image of the object.
Intensity values of attenuated x-rays are collected from small volumetric elements, called pixels. These elements are typically 0.40×0.40 mm in area and 3 cm in depth (along the direction of the x-ray beam) for a second generation CAT scanner. Once these elements are all assigned an intensity values after a complete radial and longitudinal scan, these data are processed by a computer. This processing constitutes the major part of the CAT. The inlet intensity and the outlet intensity are related through the following relationship:

Where:
I = The intensity remaining after the X-ray passes through a thickness (kV),
Io = The incident X-ray intensity (kV),
µ = Linear attenuation[2] coefficient,
L = Path Length.
This relationship applies only for a narrow mono-energetic beam of x-ray photons which travels across a homogeneous medium. If the medium in consideration is heterogeneous, the above equation holds true while replaced by the line integral of the linear attenuation coefficients. The modified form is:

The following equation relates the linear attenuation coefficients to the number stored in computer (known as the CT numbers or CTn),

Where:
CTn = CT number,
μi = x-ray linear attenuation coefficient of the object scanned,
μw = x-ray linear attenuation coefficient of water.
Linear attenuation coefficient (µ) is a function of the bulk density and the effective atomic number of the sample, given by:

Where:
ρ = Bulk oil density (kg/m3)
a = Energy-independent coefficient called Klein- Nishina coefficient
b = Constant
Z = Effective atomic number of the sample
E = Mean photon energy (kV)
When exposing a medium to x-rays, gathering the exiting x-rays from the medium (Figure 3‑22), and averaging the intensity at each cross section, a transmitted intensity vs. elevation curve can be constructed (Figure 3‑23). The resulted curve could be converted to a density curve. According to the relation between the x-ray intensity and density.
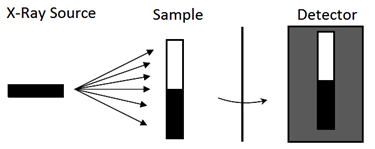
Figure 3-22: Schematic View of CAT Scanning Using X-Ray
A series of calibration tests for liquid and solid samples of known densities are performed in order to correlate the CT numbers (as the intensity of the detected x-ray), generated by the scanner, to densities. In Figure 3‑23 the calibration curves for liquid samples and liquid/solid samples are shown respectively. Using these calibration curves, the densities of the scanned samples can be back calculated.
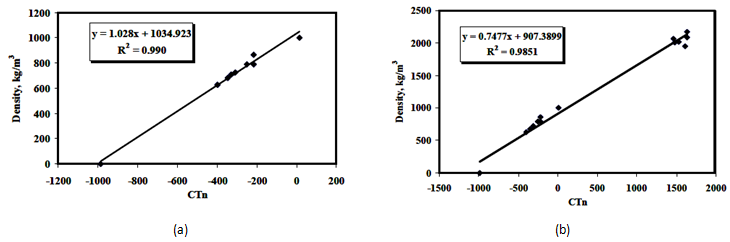
Figure 3-23: Calibration Curves for the CAT Scanning, (a) Liquid Calibration Curve, (b) Liquid-Solid Calibration Curve[3]
In contrast to the refractive index method, this method has the ability to operate with opaque solutions such as bitumen + pentane.
References
[1] L. Song, A. Kantzas, J. Bryan, 2010.
[2] In physics, attenuation (in some contexts also called extinction) is the gradual loss in intensity of any kind of flux (X-Ray) through a medium.
[3] D. Salama and A. Kantzas, 2005.
Questions?
If you have any questions at all, please feel free to ask PERM! We are here to help the community.
X-rays lose their energy as they pass through a medium, and this reduction depends on the density of the substance and the path length through that substance. CAT is based on emitting x-rays from a source which revolves around the object in consideration while one-dimensional projections of attenuated x-rays are collected by a detector on the other side of the source. These projections are collected as the sample travels through the scanner longitudinally and are used to reconstruct a two-dimensional image of the object.
Intensity values of attenuated x-rays are collected from small volumetric elements, called pixels. These elements are typically 0.40×0.40 mm in area and 3 cm in depth (along the direction of the x-ray beam) for a second generation CAT scanner. Once these elements are all assigned an intensity values after a complete radial and longitudinal scan, these data are processed by a computer. This processing constitutes the major part of the CAT. The inlet intensity and the outlet intensity are related through the following relationship:
Where:
I = The intensity remaining after the X-ray passes through a thickness (kV),
Io = The incident X-ray intensity (kV),
µ = Linear attenuation[2] coefficient,
L = Path Length.
This relationship applies only for a narrow mono-energetic beam of x-ray photons which travels across a homogeneous medium. If the medium in consideration is heterogeneous, the above equation holds true while replaced by the line integral of the linear attenuation coefficients. The modified form is:
The following equation relates the linear attenuation coefficients to the number stored in computer (known as the CT numbers or CTn),
Where:
CTn = CT number,
μi = x-ray linear attenuation coefficient of the object scanned,
μw = x-ray linear attenuation coefficient of water.
Linear attenuation coefficient (µ) is a function of the bulk density and the effective atomic number of the sample, given by:
Where:
ρ = Bulk oil density (kg/m3)
a = Energy-independent coefficient called Klein- Nishina coefficient
b = Constant
Z = Effective atomic number of the sample
E = Mean photon energy (kV)
When exposing a medium to x-rays, gathering the exiting x-rays from the medium (Figure 3‑22), and averaging the intensity at each cross section, a transmitted intensity vs. elevation curve can be constructed (Figure 3‑23). The resulted curve could be converted to a density curve. According to the relation between the x-ray intensity and density.
Figure 3-22: Schematic View of CAT Scanning Using X-Ray
A series of calibration tests for liquid and solid samples of known densities are performed in order to correlate the CT numbers (as the intensity of the detected x-ray), generated by the scanner, to densities. In Figure 3‑23 the calibration curves for liquid samples and liquid/solid samples are shown respectively. Using these calibration curves, the densities of the scanned samples can be back calculated.
Figure 3-23: Calibration Curves for the CAT Scanning, (a) Liquid Calibration Curve, (b) Liquid-Solid Calibration Curve[3]
In contrast to the refractive index method, this method has the ability to operate with opaque solutions such as bitumen + pentane.
References
[1] L. Song, A. Kantzas, J. Bryan, 2010.
[2] In physics, attenuation (in some contexts also called extinction) is the gradual loss in intensity of any kind of flux (X-Ray) through a medium.
[3] D. Salama and A. Kantzas, 2005.
Questions?
If you have any questions at all, please feel free to ask PERM! We are here to help the community.