Fundamentals of Fluid Flow in Porous Media
Chapter 2
Multi-phase Saturated Rock Properties:
Laboratory Measurement of Capillary Pressure: Mercury Injection
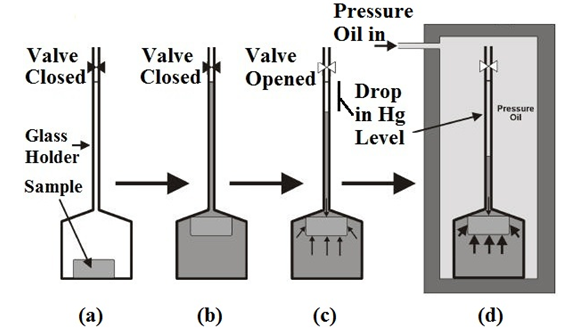
The mercury capillary pressure apparatus was developed to accelerate determination of the capillary pressure vs. saturation relationship. These tests can only be carried out on cleaned, dried test plugs. Mercury is normally a non-wetting fluid. The core sample inserted into a core chamber and evacuated (Figure 2‑58). The pressure in the system, effectively the differential across the mercury/vacuum interface, is raised in stages to force mercury enter to the core sample. The volume of mercury which has entered the pores at each pressure (as non-wetting phase saturation) is determined from volumetric readings, and the proportion of the pore space filled can be calculated. This procedure is continued until the core sample is filled with mercury or the injection pressure reach to some pre-determined value. These data gives the drainage curve. Further readings can be taken as the pressure is lowered to provide data for the imbibition case.
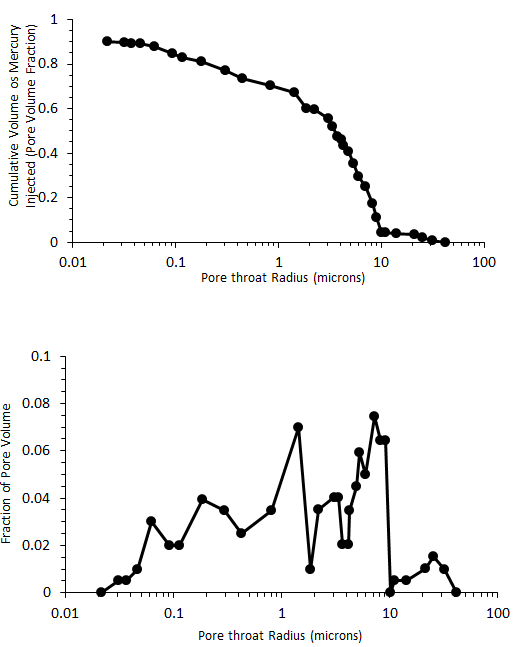
(a): Dried Sample is Evacuated It is possible from the capillary pressure curve to calculate the average size of the pores making up a stated fraction of the total pore space. The volume of mercury injected into the pores at a given pressure is usually expressed as a proportion of the total pore space, and is presented as a pore size distribution, (Figure 2‑59) or converted to oil or gas-brine data using appropriate contact angles and interfacial tensions. Typical conversions are given below: Two important advantage of this method are Two most important disadvantages of this method are If you have any questions at all, please feel free to ask PERM! We are here to help the community.
Figure 2-58: Mercury Injection Method
(b): Mercury is added while the system remains evacuated
(c): Atmospheric Pressure is applied to the sytem allowing the mercury to enter the larger pores (Macropores)
(d): pressure is raised to 60,000 psi allowing Hg to ener progressively smaller pores.
The drop in the Hg level gives the volume of the pores saturated with Hg at each pressure level


Figure 2-59: Pore Size Distribution from Mercury Injection Test
References
Questions?
