CT Scanning (Tomographic Imaging) Laboratory
PERM Inc.’s Tomographic Imaging & Porous Media Laboratory is one of the largest tomographic facilities in North America which is focused on CT Scanning Core and Laboratory Experiments for the Oil & Gas Industry.
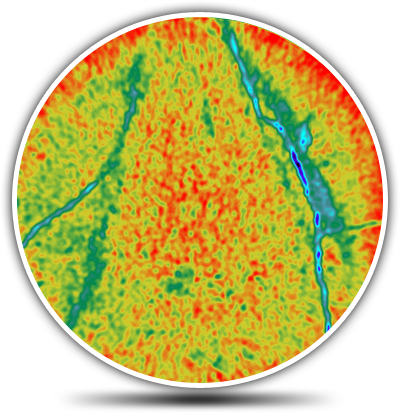
This is an example of an axial CT scan slice through full diameter core. It is colourized for density. Both density and porosity can be accurately derived from core with CT Scanners.
Tomographic Imaging Experts
Our team, headed by Dr. Apostolos Kantzas, routinely combines tomographic imaging technology with special core analysis and enhanced oil recovery laboratory tests. This allows us to gain deeper insight and visualization into what is occurring during laboratory experiments in a non-invasive manner, even at high temperatures and pressures.
PERM Inc. is one of the foremost experts when it comes to using CT Scanners for Core & SCAL Experiments.
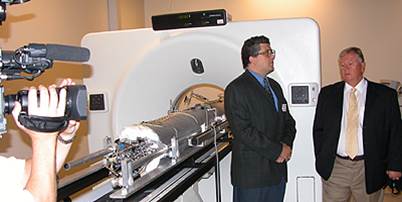
X-Ray CT Scanning Overview

General CT Information
- CT Scanners use an x-ray source and pass x-rays through the object being scanned to a detector on the other side.
- We can obtain 1-D projections of X-Ray attenuation at different angles; When just one angle is scanned it is like a regular chest x-ray.
- Numerical algorithms construct a 2-D cross-section of the object from all the 1-D projections and allow you to see inside the object.
- X-ray attenuation is proportional to density, so CT effectively gives a 2-D density cross-section of the sample.
- We can derive porosity from the images.
- This is very accurate quantitative data.
- Scanning is 100% non-intrusive.
- PERM Inc. can scan full diameter cores (3″ to 4″+) in core tubes or coreholders.
- The core can be frozen (native state) OR at reservoir temperature and pressure.
- PERM Inc. can scan many other types of laboratory experiments to gain visualization and further understanding.
- Resolution = 400 um x 400 um x thickness of the slice (usually 1-3 mm)
There are primarily 2 types of X-Ray CT Scanning
- Scout Scans (Longitudinal) 1-D projections
- Axial Scans (Cross Sectional) 2-D projections
CT Scout Scans (Longitudinal CT Scans) of Core
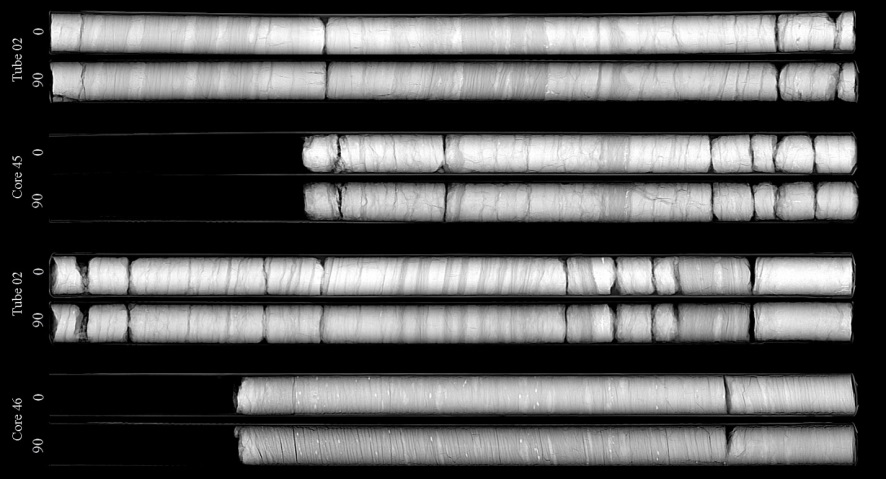
CT Scout Scan of Core while core is still in the tubes, at 0° and 90°.
CT Axial Scans (Cross Section) of Core
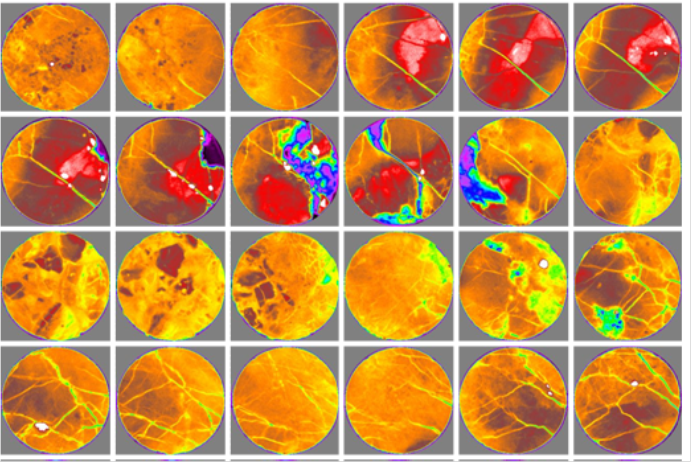
Axial scans of the core allow us to see inside the core while it is still in the core tubes. We can use this data to derive density and porosity distributions that are very accurate.
Every 1mm, an axial slice CT scan can be taken; this can generate a tremendous amount of data from the core.
What Can CT Scanning Core & Experiments Be Used For?
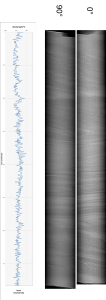
Core Scanning (CT)
PERM Inc. routinely scans core while it is still in the core tubes (plastic or metallic). This is typically done to determine core recovery, see homogeneity and heterogeneity, as well as identify core zones to be used for laboratory testing. Scanning the core can also help with depth correction.
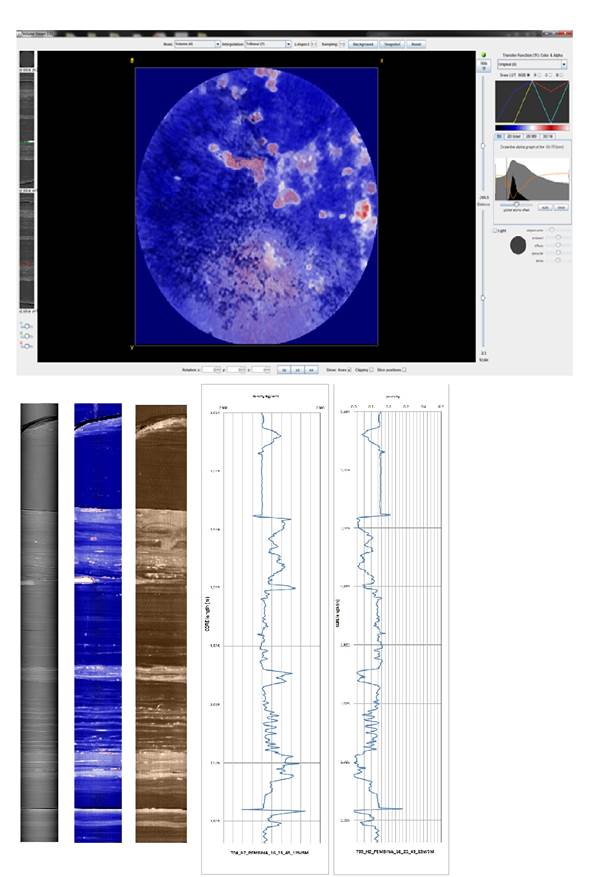
Rock/Core Characterization
CT Scanning Core helps see different zones/lithology and fractures. We also derive quantitative data such as density and porosity that are extremely accurate. We believe this is invaluable as it is a permanent record of the core prior to core testing and slabbing (where core is often destroyed).
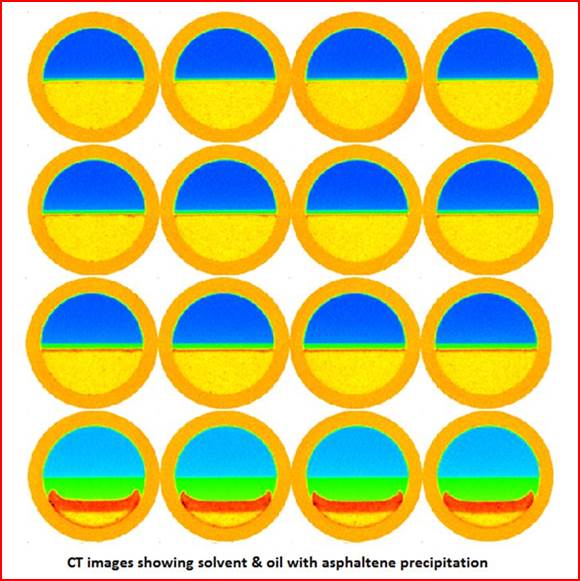
Flow Visualization & In Situ Saturation Monitoring (ISSM)
We use CT Scanners to visualize and understand what is happening in laboratory experiments, such as corefloods and phase behavior studies (among others). This can be done while experiments are running at high temperatures and pressures.
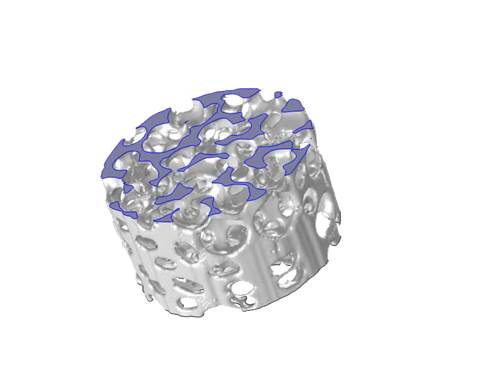
Micro-CT Scanning Core
Our micro-CT Scanner allows us to scan small plugs or cuttings and get an excellent resolution to see small fractures and pores down to a 2 micron resolution. We can then use this information to better characterize the rock and perform digital core analysis.
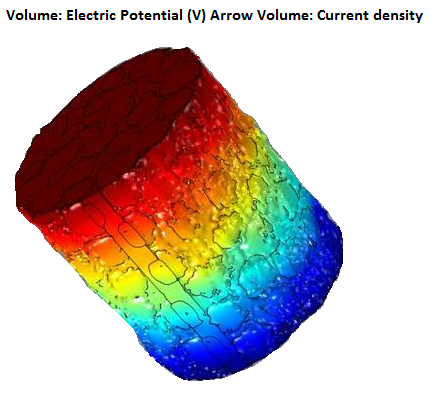
Digital Core Analysis (DCA)
PERM Inc. has spent a lot of resources developing a leading-edge method to derive core analysis properties from digital images; we call it digital core analysis. We can use small plugs or cuttings, and we image the pores and perform calculations and modelling within each pore to determine accurate core analysis properties.
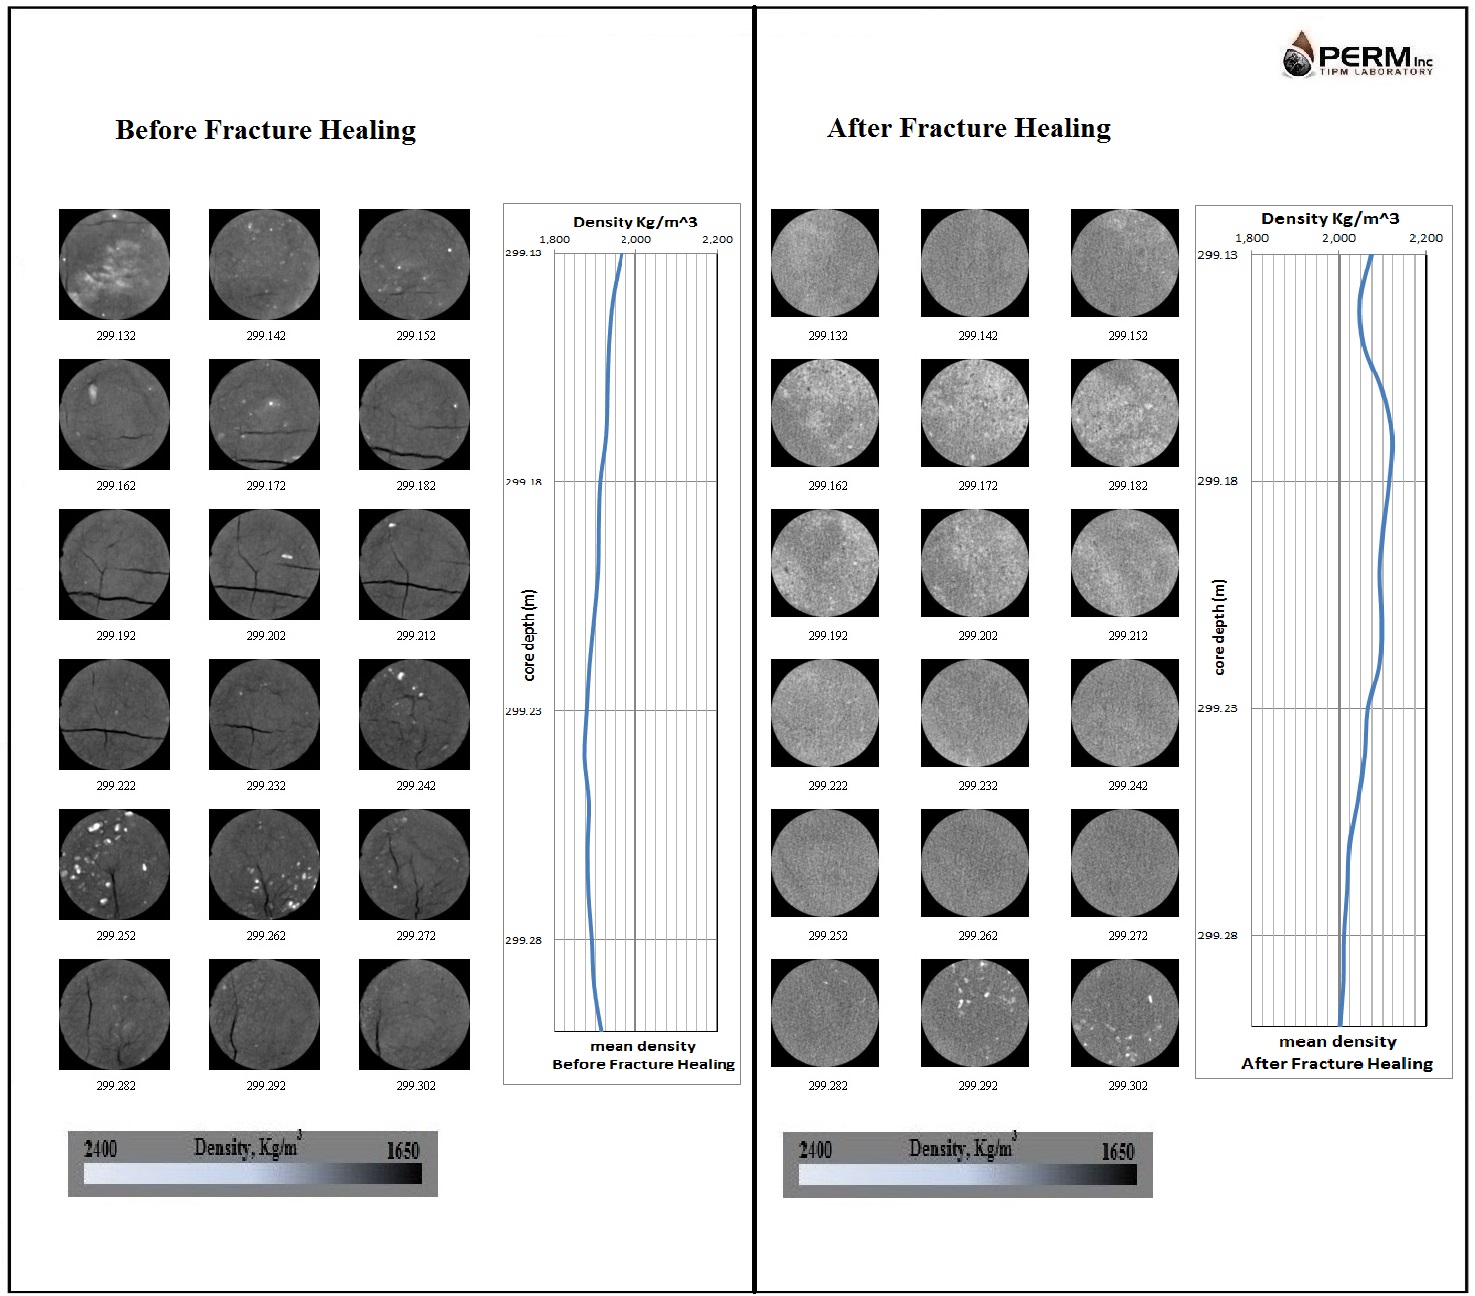
Fracture Healing Verification
Artificial fractures are induced during oilsand coring and must be healed before running tests. PERM Inc. uses CT Scanners to verify this prior to running corefloods in oilsand core.
There Are Many Uses For CT Scanning
Dual Energy Scanning (bulk mineralogy)
Fluid Distribution (quantitatively)
Formation Damage (quantitatively)
Asphaltene Precipitation
Flow Visualization & Saturation Monitoring (coreflood)
Fractures Mapping
Acidizing Evaluation
Conformance Evaluation
PVT
Cap Rock Studies
Core Lithology Analysis
Determine “Pay” zone in Shales
Mud Invasion Studies
Thermal Conductivity (for modelling)
More Examples of CT Scanning Core…
Identify Core Recovery with CT Scout Scans
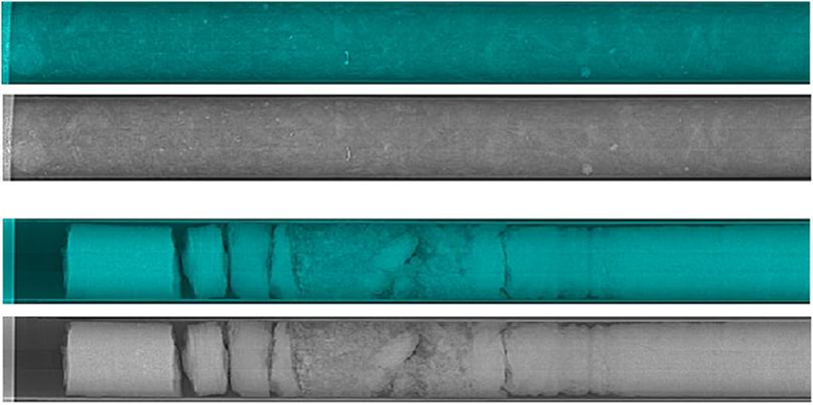
CT Scanning Core in Core Tubes to Identify Core Recovery
Find Fractures and Density Inside Core with Axial CT Scanning
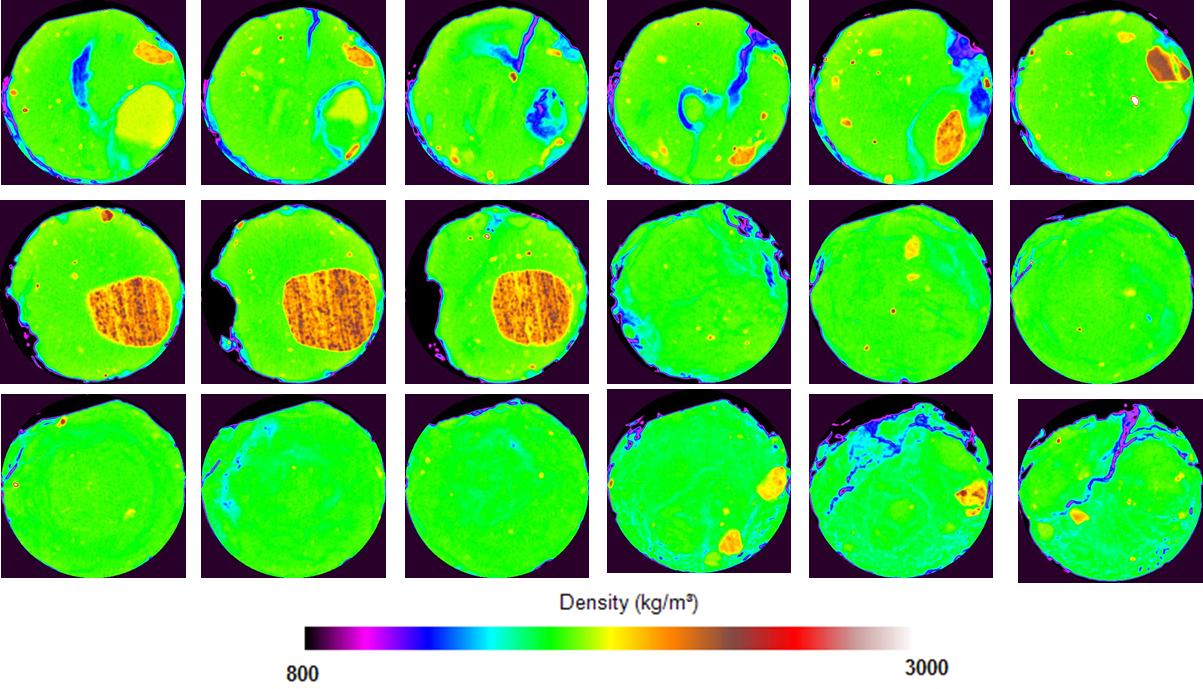
CT Axial Scans allow us to see inside the core and find fractures or potential flow blockages.
Density & Porosity Data from CT Scanning Core
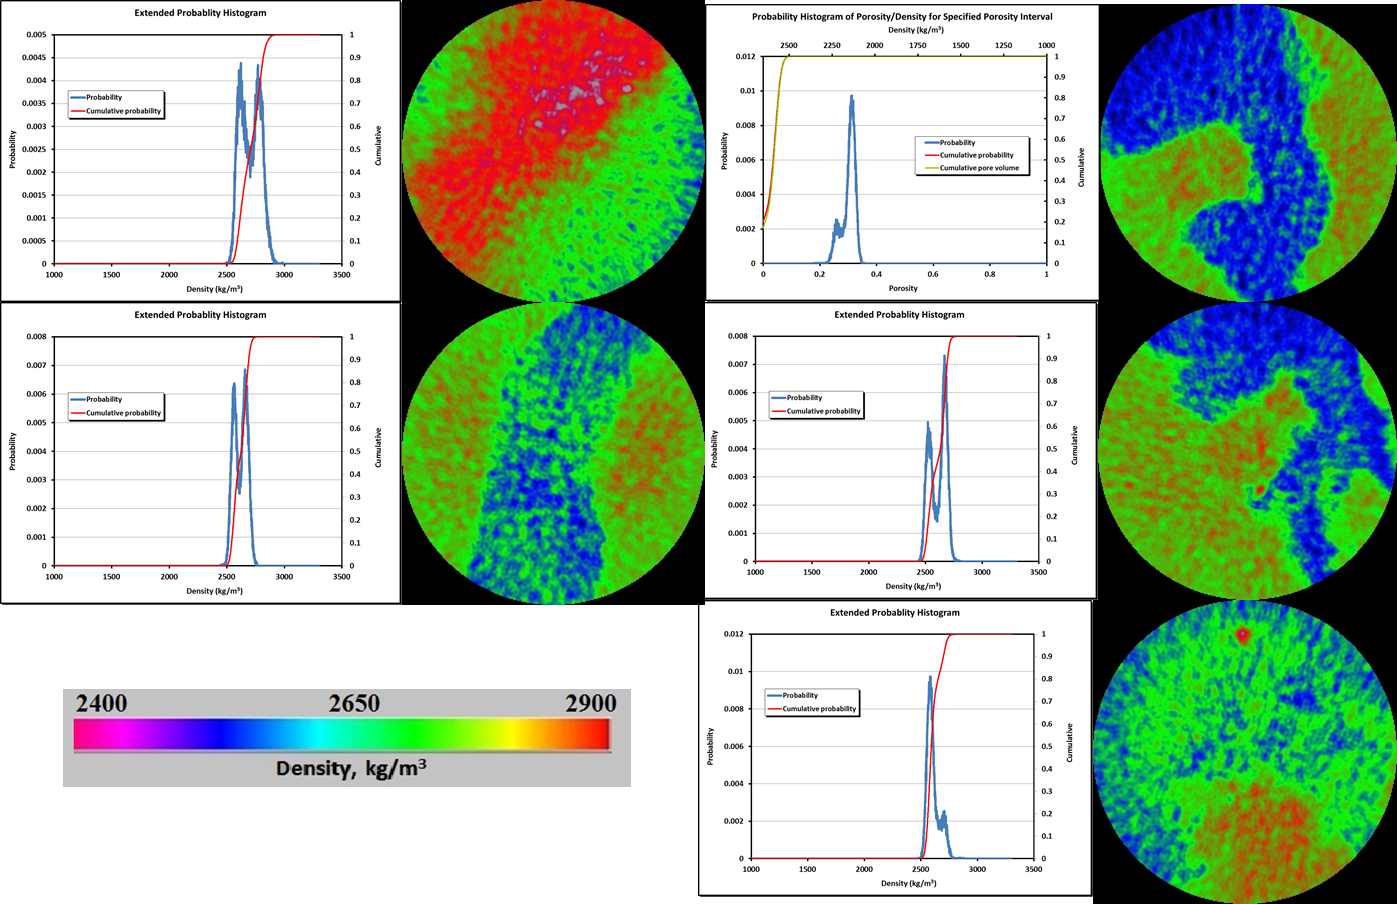
From each image or axial slice (typically 1-3 mm thick) we get quantitative data for density and porosity of the core.
Generate Density & Porosity Map from CT Scanning Core
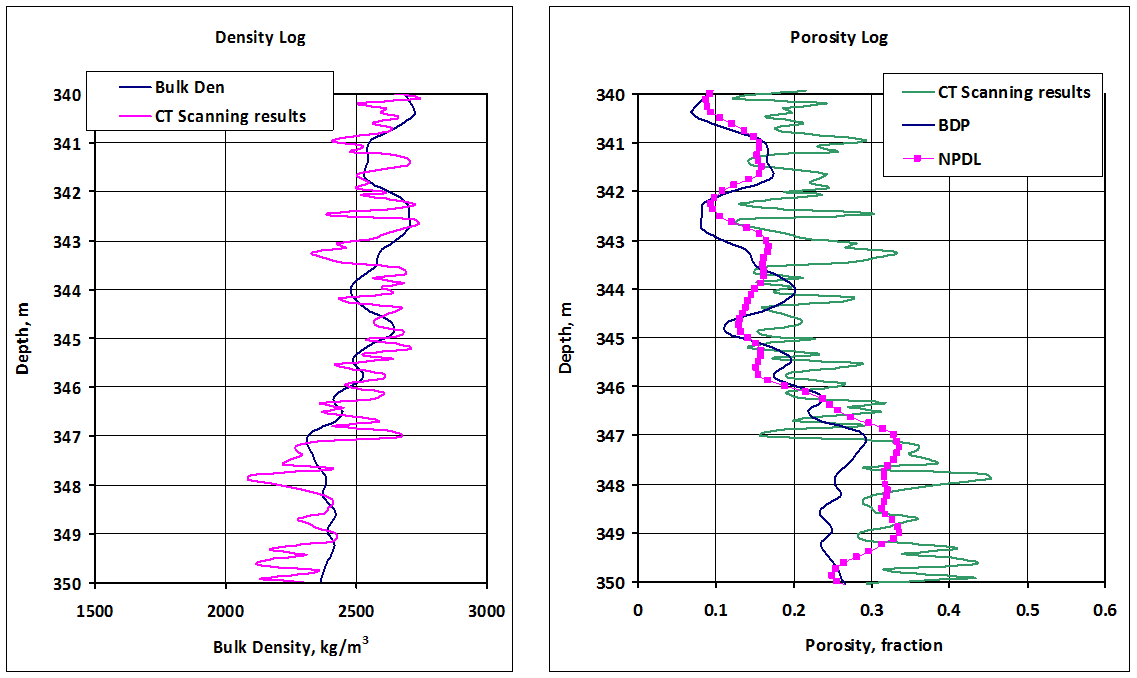

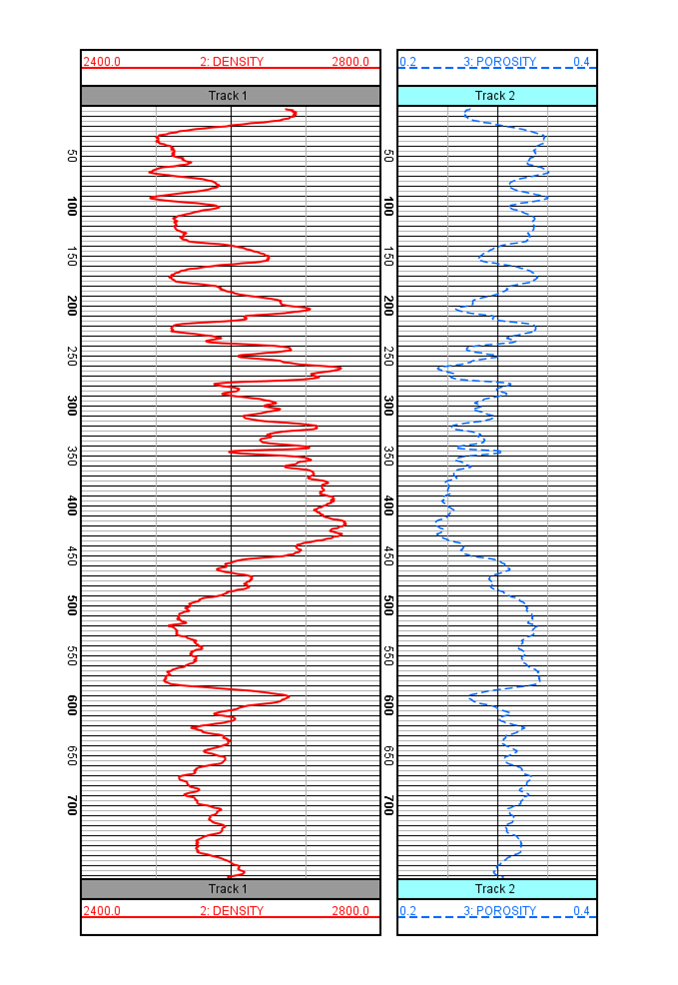
With enough axial scans, you can generate a density and porosity log that has a very high resolution. These can be calibrated against downhole logs. The resolution can be as low as one axial image every 4 cm or as high as one axial image every 1 mm.
Profiling Unconsolidated Core
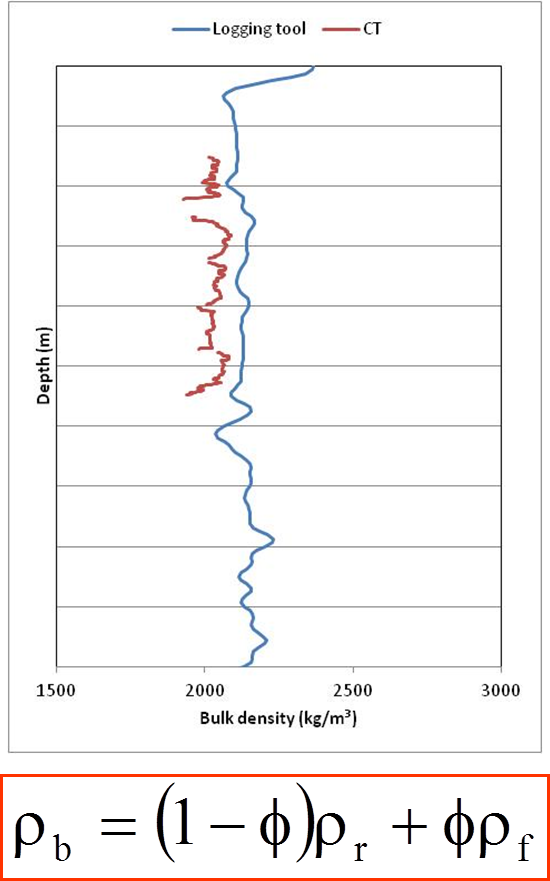
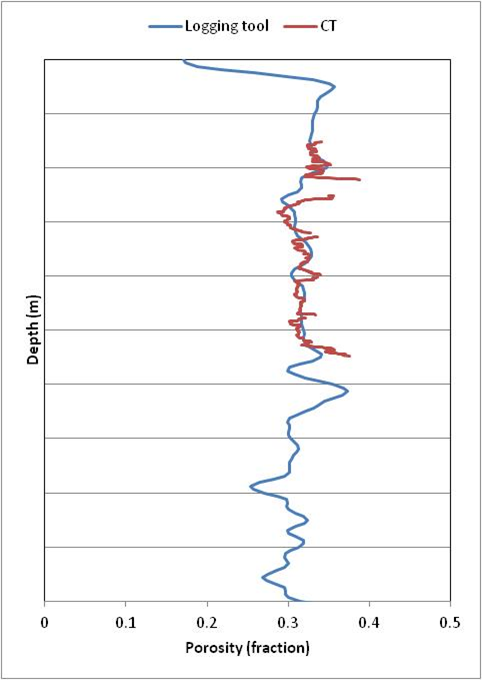
While CT Scanning gives a precise density of a core, if it is an unconsolidated core, then density may appear lower due to the absence of overburden pressure. As a result, for an unconsolidated core, the density may not match the logs precisely. In this circumstance, we can apply a correction to account for the reservoir pressure in order to match the logs. An alternative to this would be to take the core and put it in a coreholder and CT Scan while the core is under pressure.
Fracture Healing Verification by CT Scanning Core

For unconsolidated core (such as oilsand), it is important to check for artificial fractures created during coring. In the example above, we scanned an oilsand core at reservoir pressure (in a core tube) to see the initial state of the core prior to flooding. We found many artificial fractures and the density did not match log density. A very mild pressure cycling procedure was utilized to heal the fractures and then we re-scanned the core for verification. The result was core that had all artificial fractures removed and a density that matched the downhole log. The sample is then prepared to begin the coreflood and/or SCAL tests. This is an important step to take if you do not wish to flow through artificial fractures and get incorrect results.
Using CT Scanner for In-Situ Saturation Monitoring (ISSM)

CT Scan during a coreflood to add visualization and help understand and interpret the test results.
Identify How Different Rocks Affect Recovery During Corefloods
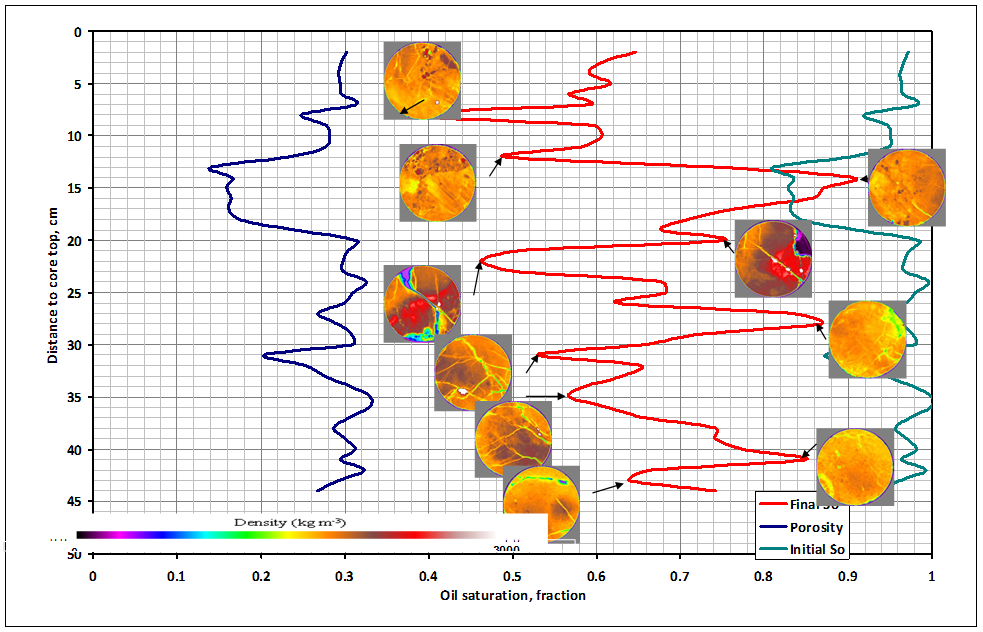
Identify how the different types of rock in your reservoir will affect oil recovery.
Residual Oil Saturation During Vertical Coreflood with CT
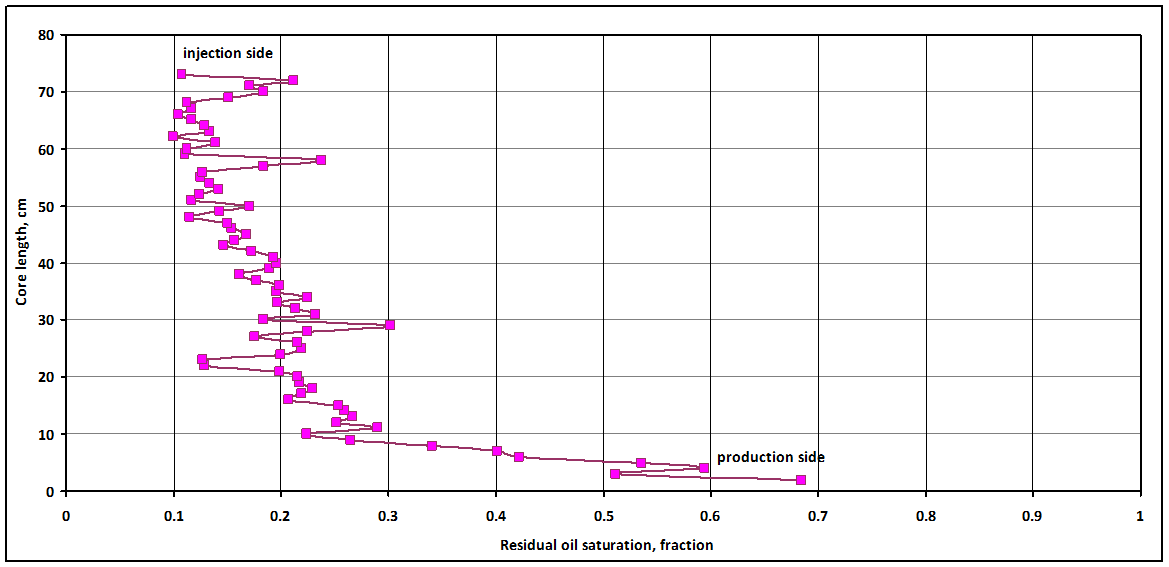
The above example was a vertical EOR coreflood; CT Scanning was used to determine end capillary effects at the bottom of the core. The oil saturation at the bottom was much higher due to these end capillary effects, which can lead one to expect lower oil recovery from the core test. Since we could tell where the oil was, we can take that into account when determining overall recovery factors that would be expected in the field.
Porosity Distribution
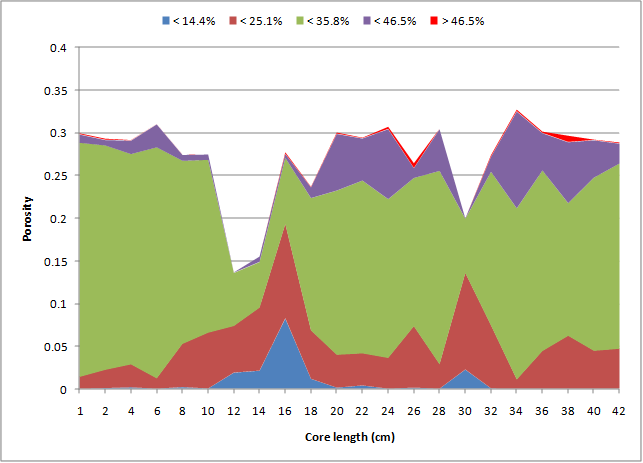
This is an example of porosity distribution for a carbonate core.
Mineralogical Mapping for Tight Reservoirs
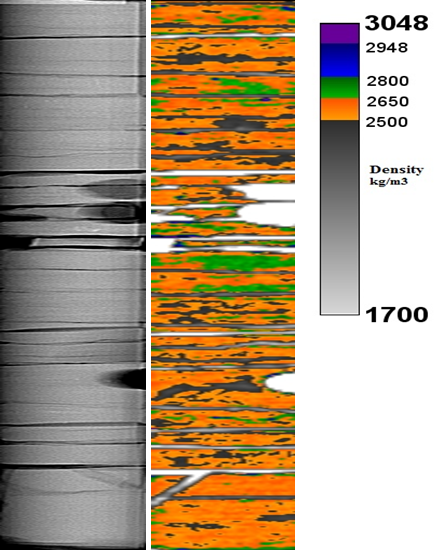
Some reservoirs are difficult to quantify “pay” versus other non-pay zones when everything is mixed and interbed. Mineralogical mapping was done with density data to figure out net pay in this mixed dolomite/shale reservoir.
CT Scanning Unconventional Reservoirs

Further analysis can be conducted on unconventional reservoirs to help with core characterization. This is one core tube that was scanned every one mm and then digitally reconstructed; it was then digitally slabbed. Beside the digital slab image, is the density and porosity log.
Bulk Mineralogy with Dual CT Scanning
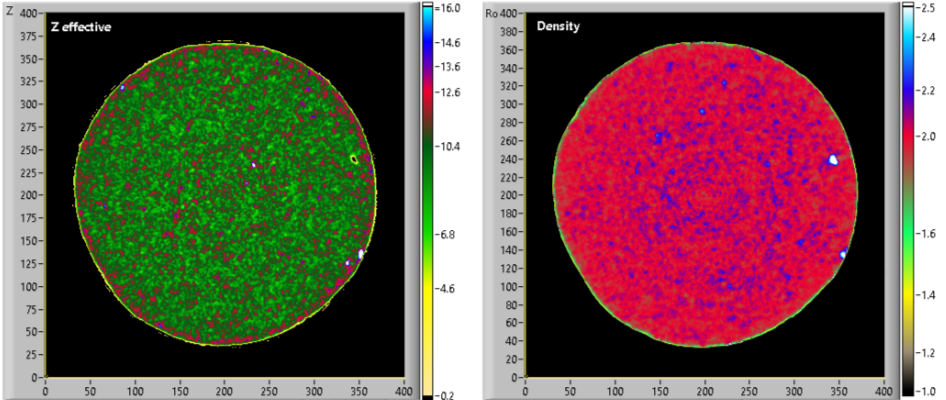
Bulk mineralogical data can be derived for some core by conducting dual energy CT Scanning on the core.
CT Core View
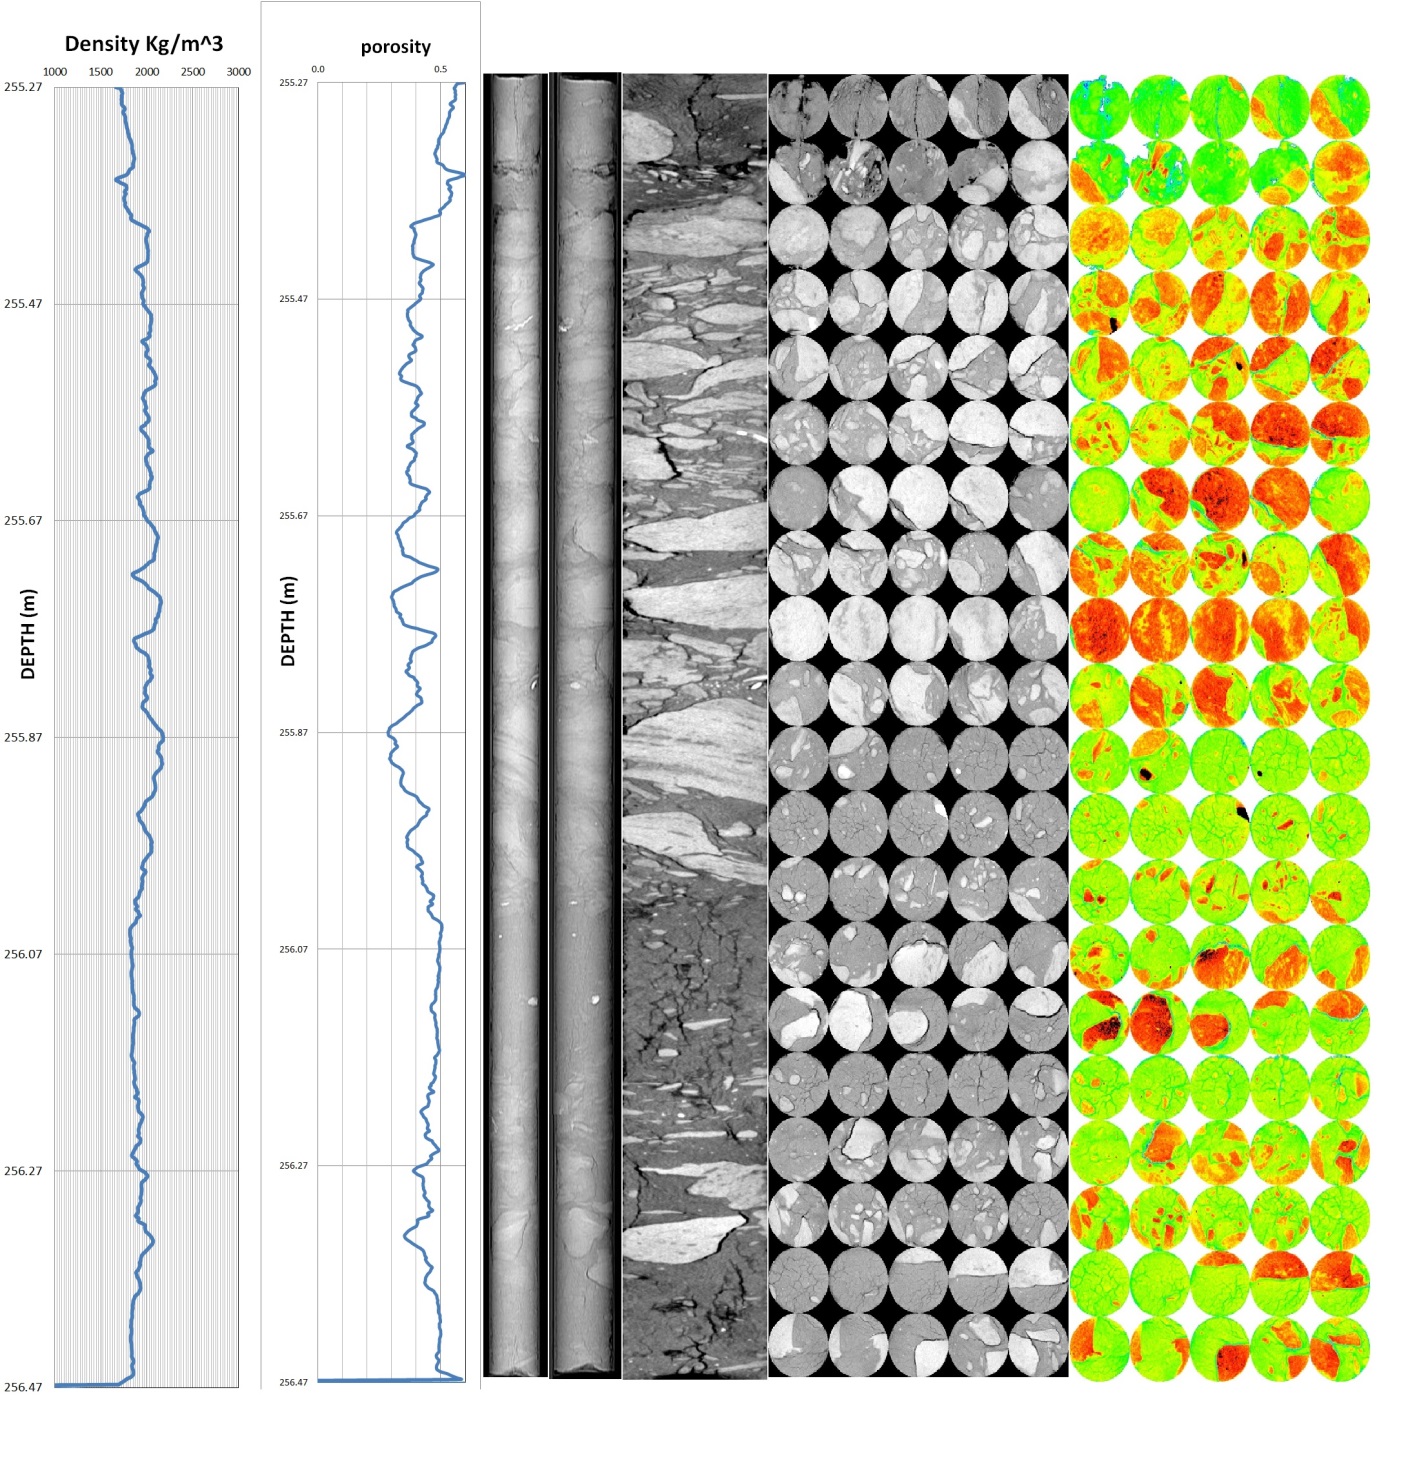
This example shows a density and porosity log, beside a Scout Scan at 0° and 90°. Beside that is a reconstruction of 1500 axial slices that have been digitally slabbed to see inside the core. Also included, is every 15th axial slice in greyscale along with the same axial images colourized for density.
3D Reconstruction with Axial CT Scanning Core
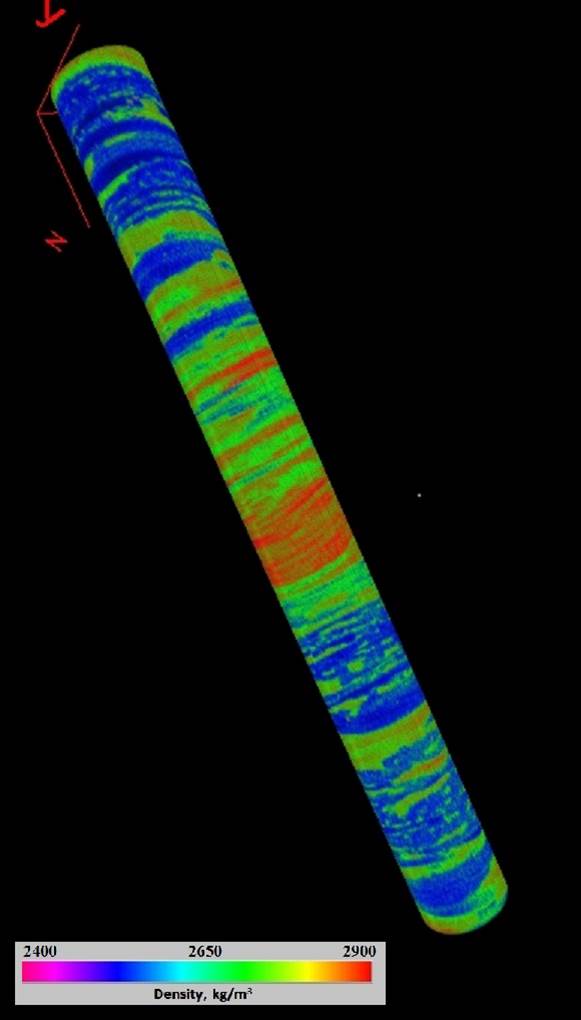
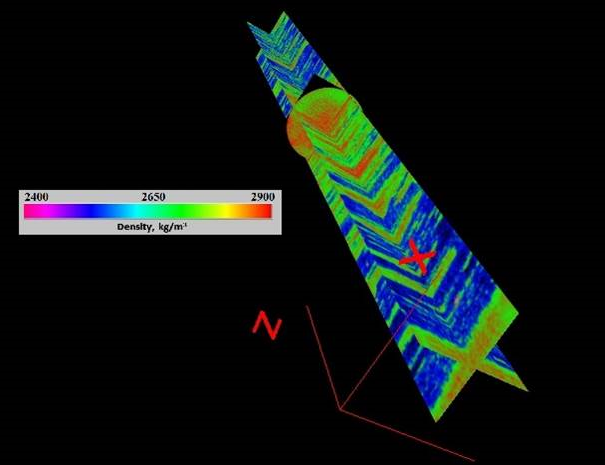
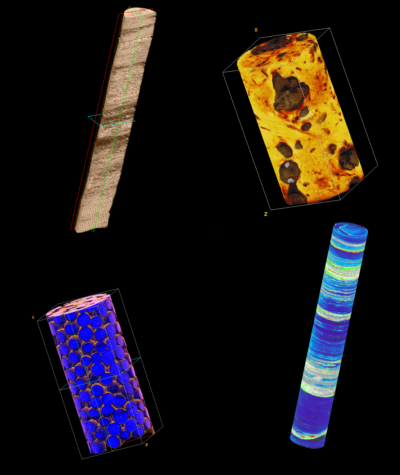
If you take enough Axial CT Scan Images side by side, every ~1 mm, then you can do a reconstruction and see inside the core as well. A tremendous amount of detail is available.
