
Fundamentals of Fluid Flow in Porous Media
Chapter 2
Relative Permeability
Relative Permeability Curves
When a wetting and a non-wetting phase flow together in a reservoir rock, each phase follows separate and distinct paths. The distribution of the two phases according to their wetting characteristics results in characteristic wetting and non-wetting phase relative permeabilities.
So for a water-oil system different relative permeability curves exist for:
- Water-wet systems
- Oil-wet systems, and
- Intermediate wettability.
Many reservoir systems fall between the two extremes, which does nothing to make laboratory water-flood data easier to interpret. However, knowledge of the two extreme cases allows misinterpretation of intermediate data to be minimized.
It should be remembered that in water-wet systems capillary forces assist water to enter pores, whereas in the oil wet case they tend to prevent water entering pores. Because of the capillary forces, the wetting phase occupies the smaller pore openings at small saturations, and these pore openings do not contribute materially to flow, it follows that the presence of small wetting phase saturation will affect the permeability of the non-wetting phase only to a limited extent. On the other hand, since the non-wetting phase occupies the central or larger pore openings which contribute materially to fluid flow through the reservoir, the relative permeability to the wetting phase is characterized by a rapid decline in value for small decreases in the wetting phase saturation from original saturation. The relative permeability to wetting phase normally approaches zero or vanishes at relatively large wetting phase saturation. This is because the wetting phase preferentially occupies the smaller pore spaces, where capillary forces are the greatest. The saturation of the water at this point is referred to as the irreducible water saturation Swir or connate water saturation Swi (Figure 2‑74). Irreducible water saturation originally is higher in consolidated rocks than unconsolidated rocks. Another important phenomenon associated with fluid flow through porous media is the concept of residual saturations. As when one immiscible fluid is displacing another, it is impossible to reduce the saturation of the displaced fluid to zero. At some small saturation, which is presumed to be the saturation at which the displaced phase ceases to be continuous, flow of the displaced phase will cease. This saturation is often referred to as the residual saturation. This is an important concept as it determines the maximum recovery from the reservoir. Conversely, a fluid must develop a certain minimum saturation before the phase will begin to flow. The saturation at which a fluid will just begin to flow is called the critical saturation. Theoretically, the critical saturation and the residual saturation should be exactly equal for any fluid; however, often they are not identical. Critical saturation is measured in the direction of increasing saturation, while irreducible saturation is measured in the direction of reducing saturation. Thus, the saturation histories of the two measurements are different.
Figure 2‑74 is a typical relative permeability curve for a water-oil system in a water-wet medium. According to the figure, the non-wetting phase begins to flow at the relatively low saturation of the non-wetting phase. The saturation of the oil at this point (point A) is called critical oil saturation Soc. Some references called this point as the “equilibrium saturation”, which the non-wetting phase becomes mobile. This saturation may vary between zero and 15% non-wetting phase saturation. As Figure 2‑74 shows attribution of oil phase to flow reach to 100% in saturation less than 100%. This is the result of capillary pressure. The capillary pressure force the wetting phase to occupy the smallest pores at low saturation that have an ignorable contribution to the flow.
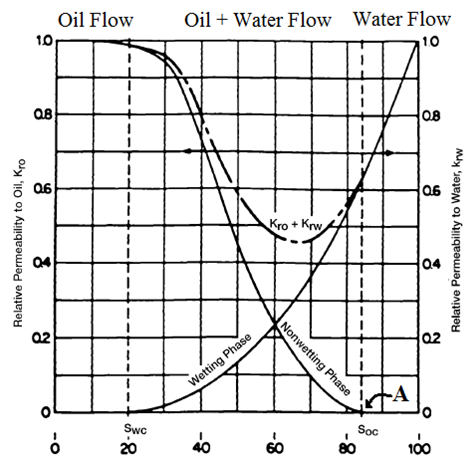
Figure 2-74: Typical Relative Permeability Curve
The curve shapes shown in Figure 2‑74 are typical for wetting and non-wetting phases and may be mentally reversed to visualize the behavior of an oil-wet system. Note also that the total permeability to both phases, krw + kro, is less than 1, in the region of two phase flow.
The following example uses capillary tubes and the HP equation to illustrate the effective reduction in permeability caused by introduction of second phase.
Example 2‑8
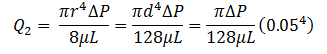
Consider five capillary tubes of length L and diameters of 0.0002, 0.001, 0.005, 0.01, and 0.05 cm. the total pore volume of the four capillary tubes are:

Total flow rate through these capillary tubes because of applying a pressure difference could be calculated, using the HP equation:

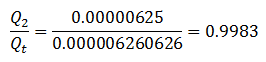
Now assume fluid number 2 with the same viscosity occupied the largest capillary tube, the same as the non-wetting phase occupied the largest pores at first. It is possible to express the conductive capacity when the two fluids are saturating the system to the conductive capacity when only one fluid saturates the system. According to eq.() the conductance capacity for fluid number 2 is:
And the ratio of conductive capacities is:
And from Darcy’s law:
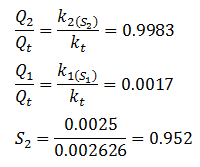
In this example the relative permeability values for the two fluids sum up to one. This behavior is not true in actual porous media. In real porous medium, there is a minute film of wetting phase that wet the surface. If consider this film in this example, it would decrease the diameter of the larger tube available for fluid number 2 to flow, thus reduces the flow capacity for the second fluid, and yet the film itself would contribute no flow capacity to the wetting phase. Thus the total fluid capacity of the tubes would be decreased. This is a rather normal feature of most relative permeability curves where sum of relative permeability values is less than one.
The above discussion may be also applied to gas-oil relative permeability data, (Figure 2‑75). Note that this might be termed gas-liquid relative permeability since it is plotted versus the liquid (water + oil) saturation. This is typical of gas-oil relative permeability data in the presence of connate water. Since the connate (irreducible) water normally occupies the smallest pores in the presence of oil and gas, it appears to make little difference whether water or oil that would also be immobile in these small pores occupies these pores. Consequently, in applying the gas-oil relative permeability data to a reservoir, the total liquid saturation is normally used as a basis for evaluating the relative permeability to the gas and oil. Note that the relative permeability curve representing oil changes completely from the shape of the relative permeability curve for oil in the water-oil system. In the water-oil system, as noted previously, oil is normally the non-wetting phase, whereas in the presence of gas the oil is the wetting phase. Consequently, in the presence of water only, the oil relative permeability curve takes on an S shape whereas in the presence of gas the oil relative-permeability curve takes on the shape of the wetting phase, or is concave upward (Figure 2‑75). Note further that the critical gas saturation Sgc is generally very small.
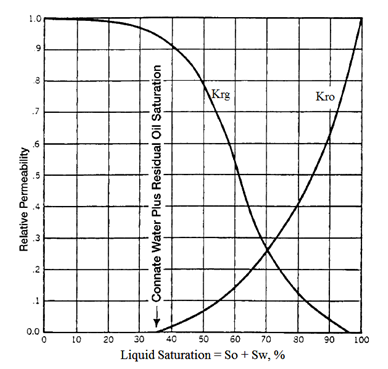
Figure 2-75: Typical Gas-Oil Relative Permeability Curve
It is important to note that relative permeability experiences hysteresis effects, so it is critical that the curves be specified as either imbibition or drainage. Hysteresis effect means that the value of relative permeability at a given saturation will be different depending on which direction the value is approached from (increasing or decreasing saturation). Drainage relative permeability refers to a saturation change where the wetting phase is decreasing from the reservoir rock, while imbibition refers to a saturation change where the wetting phase is increasing. An example of drainage would be the displacement of oil by gas during primary depletion. An example of imbibition would be water flooding a reservoir that is water wet.
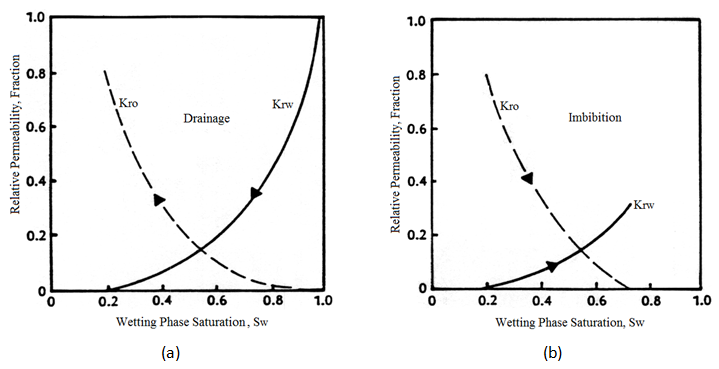
Figure 2-76: Relative Permeability Curve, (a) Drainage, (b) Imbibition
Figure 2‑76 show typical drainage and imbibition relative permeability curves for a water/oil system. The arrows indicate the direction of saturation change for each phase.
[fusion_builder_container hundred_percent=”yes” overflow=”visible” margin_top=”25″ margin_bottom=”” background_color=”rgba(255,255,255,0)”][fusion_builder_row][fusion_builder_column type=”1_1″ background_position=”left top” background_color=”” border_size=”” border_color=”” border_style=”solid” spacing=”yes” background_image=”” background_repeat=”no-repeat” padding=”” margin_top=”0px” margin_bottom=”0px” class=”” id=”” animation_type=”” animation_speed=”0.3″ animation_direction=”left” hide_on_mobile=”no” center_content=”no” min_height=”none”][fusion_separator /]
[/fusion_builder_column][/fusion_builder_row][/fusion_builder_container][fusion_builder_container hundred_percent=”yes” overflow=”visible”][fusion_builder_row][fusion_builder_column type=”1_2″ last=”no”]
[/fusion_builder_column]
[fusion_builder_column type=”1_2″ last=”yes”]
LABORATORY MEASUREMENTS OF RELATIVE PERMEABILITY >>
[/fusion_builder_column]
[fusion_builder_column type=”1_1″ background_position=”left top” background_color=”” border_size=”” border_color=”” border_style=”solid” spacing=”yes” background_image=”” background_repeat=”no-repeat” padding=”” margin_top=”0px” margin_bottom=”0px” class=”” id=”” animation_type=”” animation_speed=”0.3″ animation_direction=”left” hide_on_mobile=”no” center_content=”no” min_height=”none”][fusion_separator top=”35″/]
References
[/fusion_builder_column][fusion_builder_column type=”1_1″ background_position=”left top” background_color=”” border_size=”” border_color=”” border_style=”solid” spacing=”yes” background_image=”” background_repeat=”no-repeat” padding=”” margin_top=”0px” margin_bottom=”0px” class=”” id=”” animation_type=”” animation_speed=”0.3″ animation_direction=”left” hide_on_mobile=”no” center_content=”no” min_height=”none”][1]
Questions?
If you have any questions at all, please feel free to ask PERM! We are here to help the community.[/fusion_builder_column][/fusion_builder_row][/fusion_builder_container]